
Looker-Business-Analyst Exam Question 1
The query below shows how many uses purchased an item from each of two clothing departments.
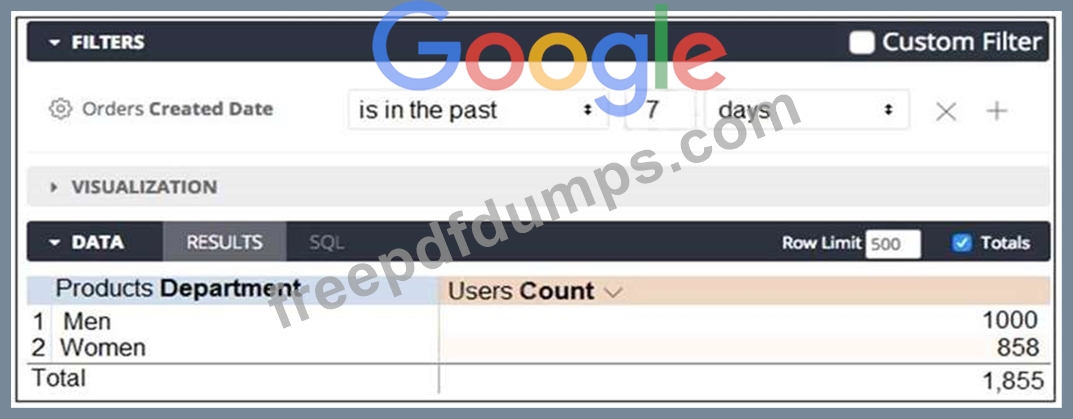
Why are the total and sum of the rows unequal?
Why are the total and sum of the rows unequal?
Looker-Business-Analyst Exam Question 2
An analyst is trying to rank companies in an Explore and visualize the rank as a column chart. The analyst selects the Brand Name dimension and the Rank dimension. They then select the column chart visualization type, but receive the error "Measure, time or numeric field required: Column graphs require at least one dimension or for the first dimension field to be of type: number or type: time".
How can the analyst resolve this error while showing the rank as a column visualization?
How can the analyst resolve this error while showing the rank as a column visualization?
Looker-Business-Analyst Exam Question 3
An analyst creates a dashboard that shows sales at an aggregate and then an individual level. This dashboard is slow to run, and the analyst sees a warning about how load times may be impacted in dashboards with more than 25 tiles.
What should the analyst create to make sure all data sources in this dashboard are connected but still load quickly?
What should the analyst create to make sure all data sources in this dashboard are connected but still load quickly?
Looker-Business-Analyst Exam Question 4
An analyst wants to schedule a dashboard in a way that makes it easier for viewing on a mobile device or for viewing a printout of the dashboard.
How can the analyst set up a schedule to accomplish this?
How can the analyst set up a schedule to accomplish this?
Looker-Business-Analyst Exam Question 5
An analyst has a dashboard with a single filter on Created Date "is in the past year", but a tile on the dashboard is returning results for only the past 7 days. When the analyst selects "Explore from Here" on the tile, there are filters on both Created Date "is in the past year" and Created Time "is in the past 7 days".
How should the analyst make sure that only the filter set on the dashboard is applied to the tile?
How should the analyst make sure that only the filter set on the dashboard is applied to the tile?