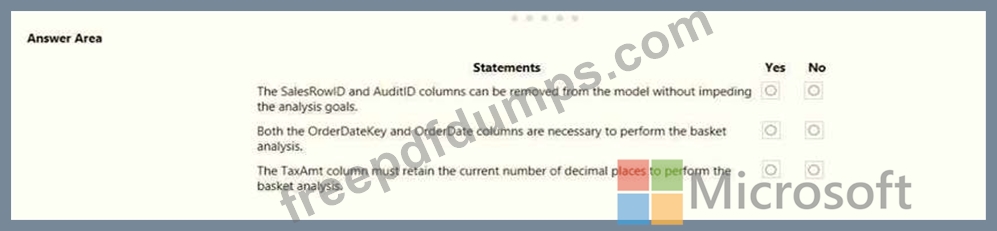
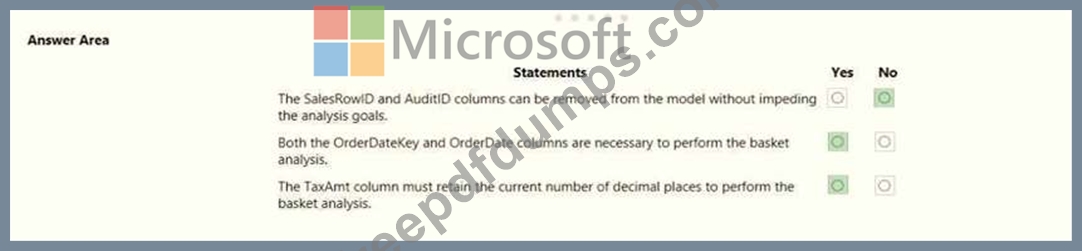
Scenario: The customer service department requires a visual that can be filtered by both sales month and ship month independently.
Incorrect Answers:
A, B: Just need two one-to-many relationships, no many-to-many relationships (with additional table) as a specific Sale occurs on a specific date.
C: Cannot make a relation between a date_id and a week_id.
D: The one-to-many relationships between the Sales and the Date tables goes in the other direction: for each date there can be many sales or shipments.
Reference:
https://docs.microsoft.com/en-us/power-bi/transform-model/desktop-relationships-understand Model the Data Testlet 2 Case Study This is a case study. Case studies are not timed separately. You can use as much exam time as you would like to complete each case. However, there may be additional case studies and sections on this exam. You must manage your time to ensure that you are able to complete all questions included on this exam in the time provided.
To answer the questions included in a case study, you will need to reference information that is provided in the case study. Case studies might contain exhibits and other resources that provide more information about the scenario that is described in the case study. Each question is independent of the other question on this case study.
At the end of this case study, a review screen will appear. This screen allows you to review your answers and to make changes before you move to the next section of the exam. After you begin a new section, you cannot return to this section.
To start the case study
To display the first question on this case study, click the Next button. Use the buttons in the left pane to explore the content of the case study before you answer the questions. Clicking these buttons displays information such as business requirements, existing environment, and problem statements. If the case study has an All Information tab, note that the information displayed is identical to the information displayed on the subsequent tabs. When you are ready to answer a question, click the Question button to return to the question.
Overview
Existing Environment
Contoso, Ltd. is a manufacturing company that produces outdoor equipment. Contoso has quarterly board meetings for which financial analysts manually prepare Microsoft Excel reports, including profit and loss statements for each of the company's four business units, a company balance sheet, and net income projections for the next quarter.
Data and Sources
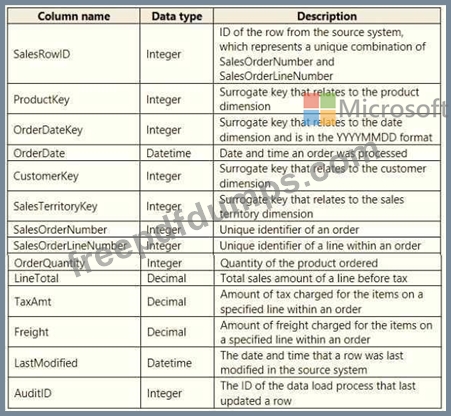
Data for the reports comes from three sources. Detailed revenue, cost, and expense data comes from an Azure SQL database. Summary balance sheet data comes from Microsoft Dynamics 365 Business Central.
The balance sheet data is not related to the profit and loss results, other than they both relate dates.
Monthly revenue and expense projections for the next quarter come from a Microsoft SharePoint Online list.
Quarterly projections relate to the profit and loss results by using the following shared dimensions: date, business unit, department, and product category.
Net Income Projection Data
Net income projection data is stored in a SharePoint Online list named Projections in the format shown in the following table.
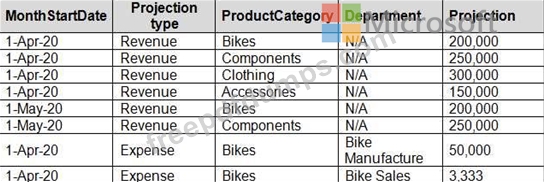
Revenue projections are set at the monthly level and summed to show projections for the quarter.
Balance Sheet Data
The balance sheet data is imported with final balances for each account per month in the format shown in the following table.
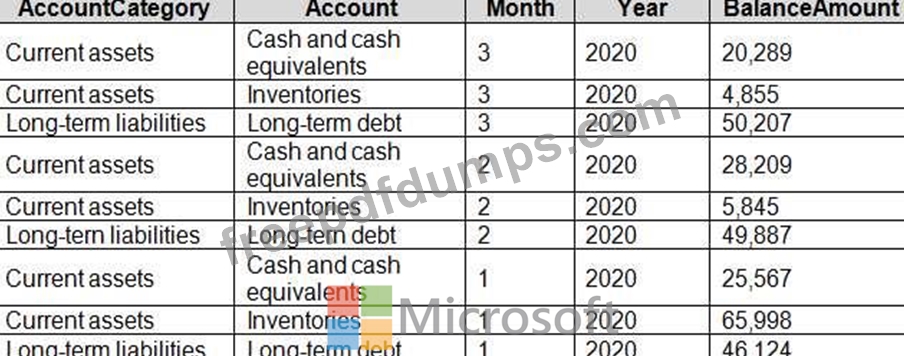
There is always a row for each account for each month in the balance sheet data.
Dynamics 365 Business Central Data
Business Central contains a product catalog that shows how products roll up to product categories, which roll up to business units.
Revenue data is provided at the date and product level. Expense data is provided at the date and department level.
Business Issues
Historically, it has taken two analysts a week to prepare the reports for the quarterly board meetings. Also, there is usually at least one issue each quarter where a value in a report is wrong because of a bad cell reference in an Excel formula. On occasion, there are conflicting results in the reports because the products and departments that roll up to each business unit are not defined consistently.
Requirements
Planned Changes
Contoso plans to automate and standardize the quarterly reporting process by using Microsoft Power BI. The company wants to how long it takes to populate reports to less than two days. The company wants to create common logic for business units, products, and departments to be used across all reports, including, but not limited, to the quarterly reporting for the board.
Technical Requirements
Contoso wants the reports and datasets refreshed with minimal manual effort.
The company wants to provide a single package of reports to the board that contains custom navigation and links to supplementary information.
Maintenance, including manually updating data and access, must be minimized as much as possible.
Security Requirements
The reports must be made available to the board from powerbi.com. A mail-enabled security group will be used to share information with the board.
The analysts responsible for each business unit must see all the data the board sees, except the profit and loss data, which must be restricted to only their business unit's data. The analysts must be able to build new reports from the dataset that contains the profit and loss data, but any reports that the analysts build must not be included in the quarterly reports for the board. The analysts must not be able to share the quarterly reports with anyone.
Report Requirements
You plan to relate the balance sheet to a standard date table in Power BI in a many-to-one relationship based on the last day of the month. At least one of the balance sheet reports in the quarterly reporting package must show the ending balances for the quarter, as well as for the previous quarter.
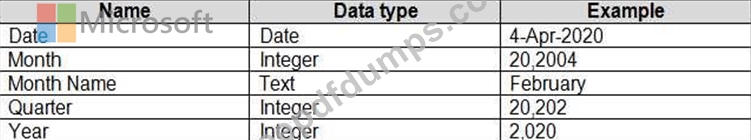
Projections must contain a column named RevenueProjection that contains the revenue projection amounts. A relationship must be created from Projections to a table named Date that contains the columns shown in the following table.
The relationships between products and departments to business units must be consistent across all reports.
The board must be able to get the following information from the quarterly reports:
* Revenue trends over time
* Ending balances for each account
* A comparison of expenses versus projections by quarter
* Changes in long-term liabilities from the previous quarter
* A comparison of quarterly revenue versus the same quarter during the prior year