
DA-100 Exam Question 61
You have the visual shown in the Original exhibit. (Click the Original tab.)
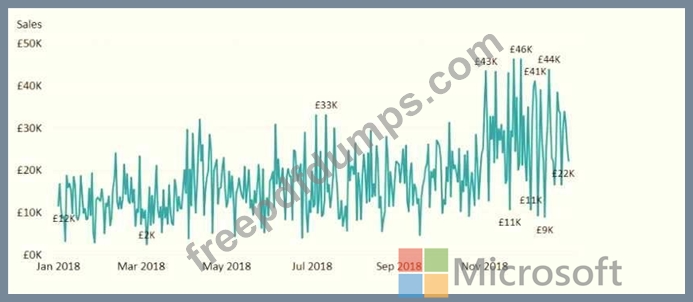
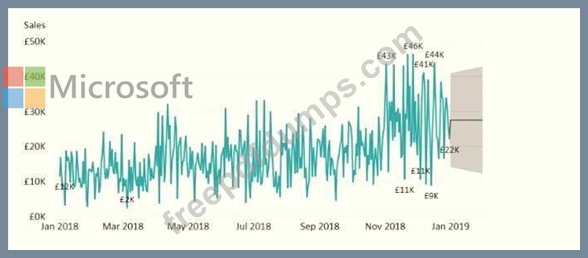
You need to configure the visual as shown in the Modified exhibit. (Click the Modified tab.)
What should you add to the visual?
You need to configure the visual as shown in the Modified exhibit. (Click the Modified tab.)
What should you add to the visual?
DA-100 Exam Question 62
You are preparing a financial report in Power BI.
You connect to the data stored in a Microsoft Excel spreadsheet by using Power Query Editor as shown in the following exhibit.
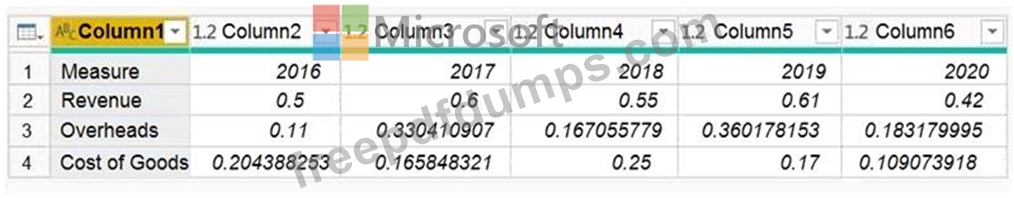
You need to prepare the data to support the following:
Visualizations that include all measures in the data over time
Year-over-year calculations for all the measures
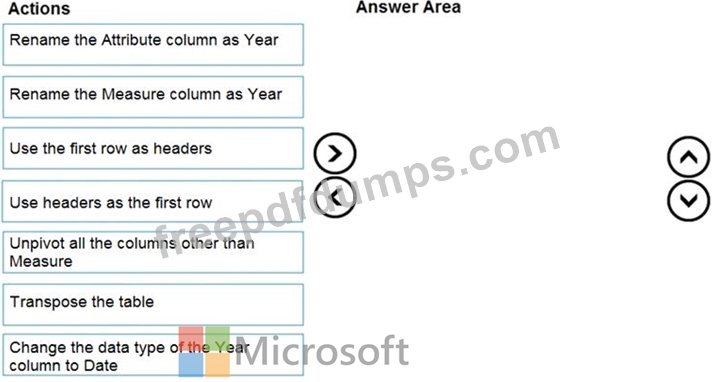
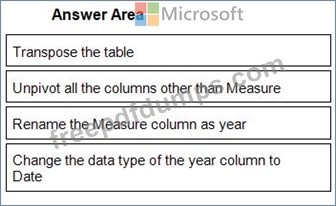
Which four actions should you perform in sequence? To answer, move the appropriate actions from the list of actions to the answer area and arrange them in the correct order.
You connect to the data stored in a Microsoft Excel spreadsheet by using Power Query Editor as shown in the following exhibit.
You need to prepare the data to support the following:
Visualizations that include all measures in the data over time
Year-over-year calculations for all the measures
Which four actions should you perform in sequence? To answer, move the appropriate actions from the list of actions to the answer area and arrange them in the correct order.
DA-100 Exam Question 63
You need to create a visual as shown in the following exhibit.
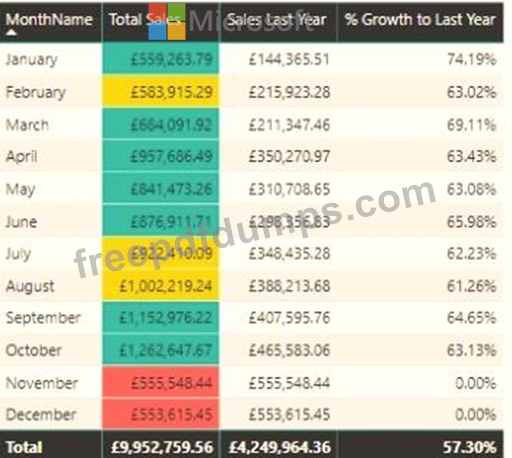
The indicator color for Total Sales will be based on % Growth to Last Year.
The solution must use the existing calculations only.
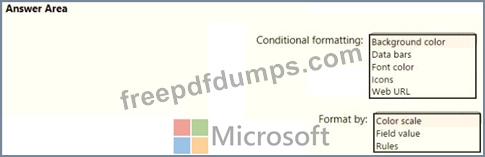
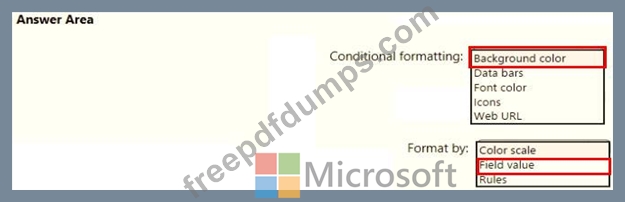
How should you configure the visual? To answer, select the appropriate options in the answer area.
NOTE: Each correct selection is worth one point.
The indicator color for Total Sales will be based on % Growth to Last Year.
The solution must use the existing calculations only.
How should you configure the visual? To answer, select the appropriate options in the answer area.
NOTE: Each correct selection is worth one point.
DA-100 Exam Question 64
Your company has employees in 10 states.
The company recently decided to associate each state to one of the following three regions: East, West, and North.
You have a data model that contains employee information by state. The model does NOT include region information.
You have a report that shows the employees by state.
You need to view the employees by region as quickly as possible.
What should you do?
DA-100 Exam Question 65
Note: This question is part of a series of questions that use the same scenario. For your convenience, the scenario is repeated in each question. Each question presents a different goal and answer choices, but the text of the scenario is the same in each question in this series.
You have a Microsoft SQL Server database that contains the following tables.
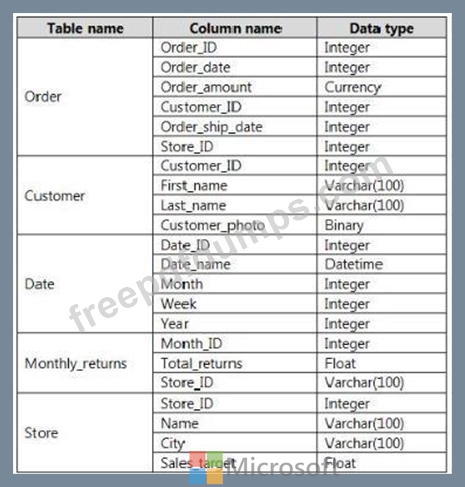
The following columns contain date information:
- Date[Month] in the mmyyyy format
- Date[Date_ID] in the ddmmyyyy format
- Date[Date_name] in the mm/dd/yyyy format
- Monthly_returns[Month_ID] in the mmyyyy format
The Order table contains more than one million rows.
The Store table has a relationship to the Monthly_returns table on the Store_ID column. This is the only relationship between the tables.
You plan to use Power BI Desktop to create an analytics solution for the data.
You are modeling the data in Power BI.
You need to import only a sample of the data from the Order table.
What are two possible ways to achieve the goal? Each correct answer presents a complete solution.
NOTE: Each correct selection is worth one point.
You have a Microsoft SQL Server database that contains the following tables.
The following columns contain date information:
- Date[Month] in the mmyyyy format
- Date[Date_ID] in the ddmmyyyy format
- Date[Date_name] in the mm/dd/yyyy format
- Monthly_returns[Month_ID] in the mmyyyy format
The Order table contains more than one million rows.
The Store table has a relationship to the Monthly_returns table on the Store_ID column. This is the only relationship between the tables.
You plan to use Power BI Desktop to create an analytics solution for the data.
You are modeling the data in Power BI.
You need to import only a sample of the data from the Order table.
What are two possible ways to achieve the goal? Each correct answer presents a complete solution.
NOTE: Each correct selection is worth one point.
Premium Bundle
Newest DA-100 Exam PDF Dumps shared by Actual4test.com for Helping Passing DA-100 Exam! Actual4test.com now offer the updated DA-100 exam dumps, the Actual4test.com DA-100 exam questions have been updated and answers have been corrected get the latest Actual4test.com DA-100 pdf dumps with Exam Engine here:
(150 Q&As Dumps, 30%OFF Special Discount: Freepdfdumps)