
DP-500 Exam Question 1
You are using a Python notebook in an Apache Spark pool in Azure Synapse Analytics. You need to present the data distribution statistics from a DataFrame in a tabular view. Which method should you invoke on the DataFrame?
DP-500 Exam Question 2
You are using a Python notebook in an Apache Spark pool in Azure Synapse Analytics.
You need to present the data distribution statistics from a DataFrame in a tabular view.
Which method should you invoke on the DataFrame?
You need to present the data distribution statistics from a DataFrame in a tabular view.
Which method should you invoke on the DataFrame?
DP-500 Exam Question 3
You have a Power Bl dataset that contains the following measures:
* Budget
* Actuals
* Forecast
You create a report that contains 10 visuals.
You need provide users with the ability to use a slicer to switch between the measures in two visuals only.
You create a dedicated measure named cg Measure switch.
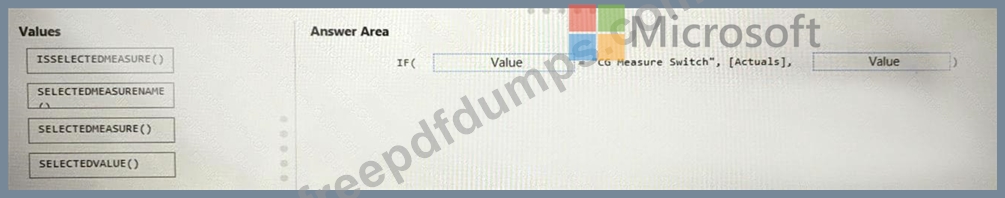
How should you complete the DAX expression for the Actuals measure? To answer, drag the appropriate values to the targets. Each value may be used once, more than once, or not at all. You may need to drag the split bar between panes or scroll to view content.
NOTE: Each correct selection is worth one point.
* Budget
* Actuals
* Forecast
You create a report that contains 10 visuals.
You need provide users with the ability to use a slicer to switch between the measures in two visuals only.
You create a dedicated measure named cg Measure switch.
How should you complete the DAX expression for the Actuals measure? To answer, drag the appropriate values to the targets. Each value may be used once, more than once, or not at all. You may need to drag the split bar between panes or scroll to view content.
NOTE: Each correct selection is worth one point.

DP-500 Exam Question 4
Note: This question is part of a series of questions that present the same scenario. Each question in the series contains a unique solution that might meet the stated goals. Some question sets might have more than one correct solution, while others might not have a correct solution.
After you answer a question in this section, you will NOT be able to return to it. As a result, these questions will not appear in the review screen.
You have a Power Bl dataset named Datasetl.
In Dataset1, you currently have 50 measures that use the same time intelligence logic.
You need to reduce the number of measures, while maintaining the current functionality.
Solution: From DAX Studio, you write a query that uses grouping sets.
Does this meet the goal?
DP-500 Exam Question 5
You have an Azure Synapse notebook.
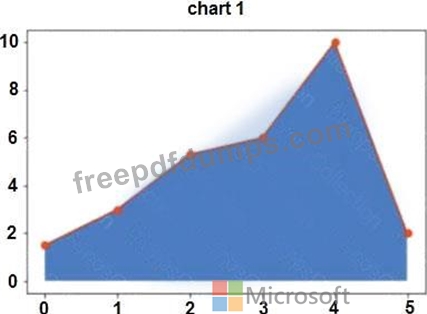
You need to create the visual shown in the following exhibit.
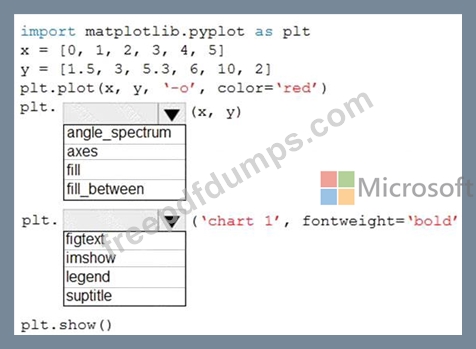
How should you complete the code? To answer, select the appropriate options in the answer area.
NOTE: Each correct selection is worth one point.
You need to create the visual shown in the following exhibit.
How should you complete the code? To answer, select the appropriate options in the answer area.
NOTE: Each correct selection is worth one point.
