
PL-300 Exam Question 56
You have a column named UnitslnStock as shown in the following exhibit


PL-300 Exam Question 57
You have a report that contains three pages. One of the pages contains a KPI visualization. You need to filter all the visualizations in the report except for the KPI visualization. Which two actions should you perform? Each correct answer presents part of the solution. NOTE: Each correct selection is worth one point.
PL-300 Exam Question 58
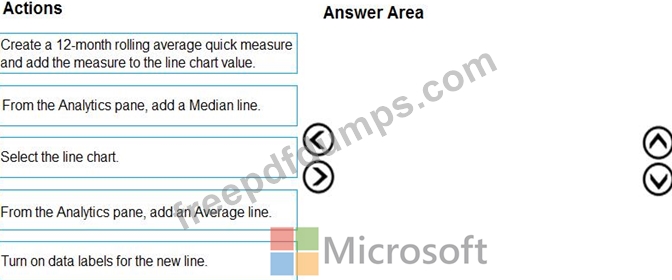
You have the line chart shown in the exhibit. (Click the Exhibit tab.)
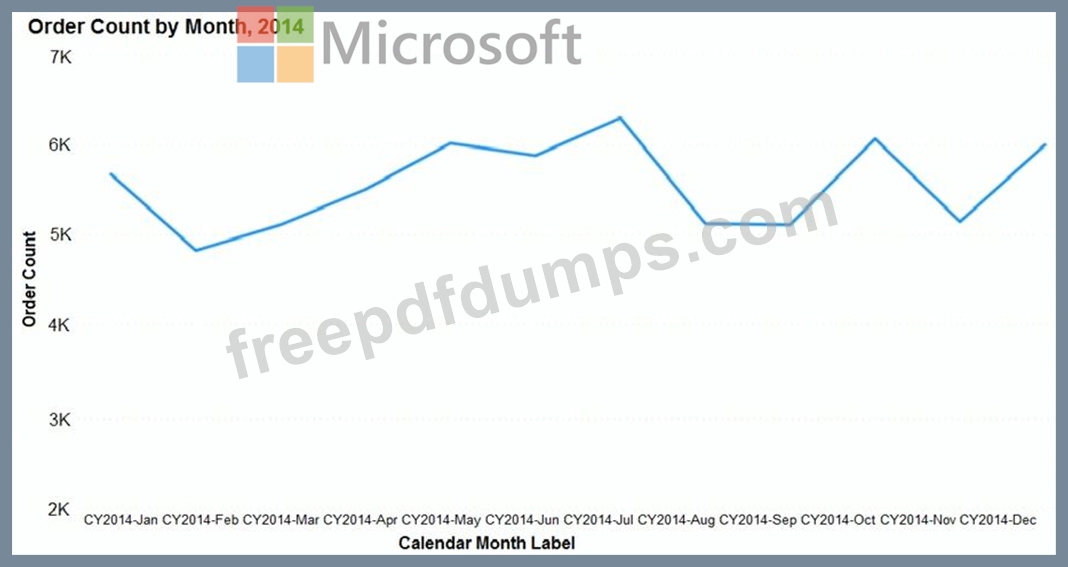
You need to modify the chart to meet the following requirements:
Identify months that have order counts above the mean.
Display the mean monthly order count.
Which three actions should you perform in sequence? To answer, move the appropriate actions from the list of actions to the answer area and arrange them in the correct order.

PL-300 Exam Question 59
You plan to develop a Power BI report that has a bar chart to display the number of customers by location. You have a table named Customer that has the following columns:
* Customer ID
* CustomerName
* Address
* City
* ProvState
* Country
You need to allow users to drill down by location. The report will display the number of each customer by Country, and drill down to ProvState, and then to City. How should you configure the drill down in the bar chart?
* Customer ID
* CustomerName
* Address
* City
* ProvState
* Country
You need to allow users to drill down by location. The report will display the number of each customer by Country, and drill down to ProvState, and then to City. How should you configure the drill down in the bar chart?
PL-300 Exam Question 60
You have a Power Bl report for the marketing department. The report reports on web traffic to a blog and contains data from the following tables.

There is a one-to-many relationship from Posts to Traffic that uses the URL and URL Visited columns. The report contains the visuals shown in the following table.

The dataset takes a long time to refresh.
You need to modify Posts and Traffic queries to reduce toad times.
Which two actions will reduce the toad times? Each correct answer presents part of the solution.
NOTE: Each correct selection is worth one point.
There is a one-to-many relationship from Posts to Traffic that uses the URL and URL Visited columns. The report contains the visuals shown in the following table.
The dataset takes a long time to refresh.
You need to modify Posts and Traffic queries to reduce toad times.
Which two actions will reduce the toad times? Each correct answer presents part of the solution.
NOTE: Each correct selection is worth one point.