
PL-300 Exam Question 1
You have a Microsoft Excel workbook that contains two sheets named Sheet1 and Sheet2. Sheet1 contains the following table named Table1.
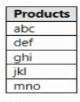
Sheet2 contains the following table named Table2.
Sheet2 contains the following table named Table2.

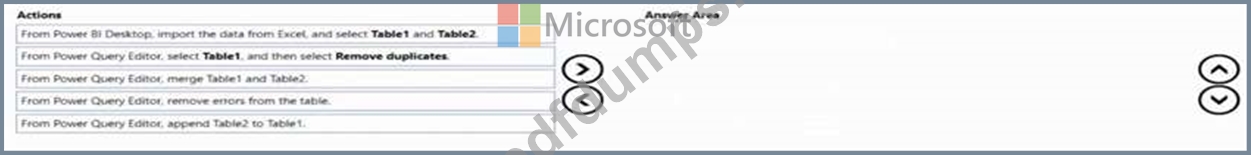
PL-300 Exam Question 2
You need to create the Top Customers report.
Which type of filter should you use, and at which level should you apply the filter? To answer, select the appropriate options in the answer area.
NOTE: Each correct selection is worth one point.
Which type of filter should you use, and at which level should you apply the filter? To answer, select the appropriate options in the answer area.
NOTE: Each correct selection is worth one point.

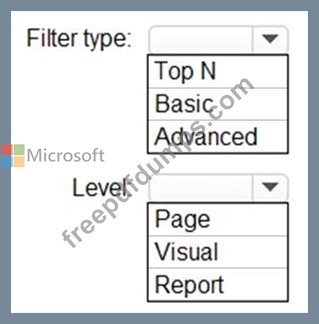
PL-300 Exam Question 3
You have a Power Bl table named Customer that contains a field named Email Address.
You discover that multiple records contain the same email address.
You need to create a calculated column to identify which records have duplicate email addresses.
How should you complete the OAX expression for the calculated column? To answer, drag the appropriate values to the correct targets. Each value may be used once, more than once, or not at all. You may need to drag the split bar between panes or scroll to view content NOTE: Each correct selection is worth one point.

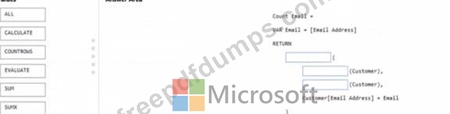
PL-300 Exam Question 4
You have a Power BI model that contains a table named Sales. Sales has the following three measures:
* A measure named Total Sales Last Year that displays the sales from the previous calendar year. The
* current value is 32.89 million.
* A measure named Total Sales This Year that displays the sales from the current calendar year. The current value is 11.69 million.
* A measure named Total Sales Difference that uses a DAX formula of Sales[Last Year] - Sales[This Year].
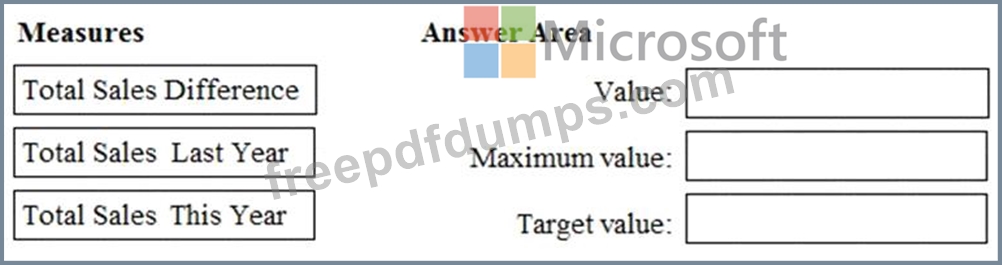
You need to create the following visualization.
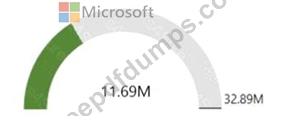
How should you configure the visualization? To answer, drag the appropriate measures to the correct fields.
Each value may be used once, more than once, or not at all. You may need to drag the split bar between panes or scroll to view content.
NOTE: Each correct selection is worth one point.
* A measure named Total Sales Last Year that displays the sales from the previous calendar year. The
* current value is 32.89 million.
* A measure named Total Sales This Year that displays the sales from the current calendar year. The current value is 11.69 million.
* A measure named Total Sales Difference that uses a DAX formula of Sales[Last Year] - Sales[This Year].
You need to create the following visualization.
How should you configure the visualization? To answer, drag the appropriate measures to the correct fields.
Each value may be used once, more than once, or not at all. You may need to drag the split bar between panes or scroll to view content.
NOTE: Each correct selection is worth one point.


PL-300 Exam Question 5
You are creating a dashboard by using the Power Bl service.
You have an existing report page that contains three charts.
You need to add the charts to the dashboard while maintaining the interactivity between the charts.
What should you do?
You have an existing report page that contains three charts.
You need to add the charts to the dashboard while maintaining the interactivity between the charts.
What should you do?