
PL-300 Exam Question 1
You have a report in Power BI Desktop.
You add a key influencers visual as shown in the exhibit. (Click the Exhibit tab.)
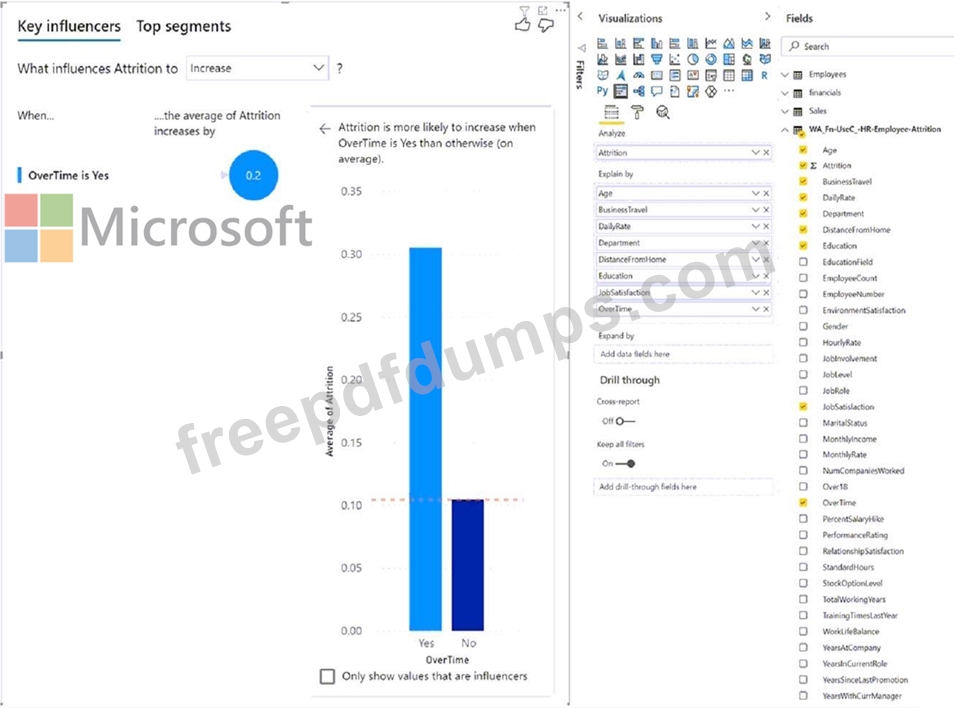
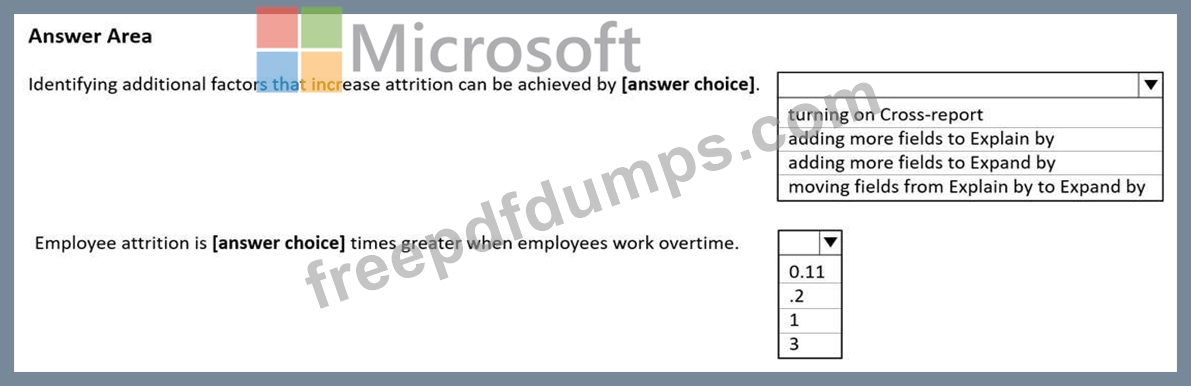
Use the drop-down menus to select the answer choice that completes each statement based on the information presented in the graphic.
NOTE: Each correct selection is worth one point.
You add a key influencers visual as shown in the exhibit. (Click the Exhibit tab.)
Use the drop-down menus to select the answer choice that completes each statement based on the information presented in the graphic.
NOTE: Each correct selection is worth one point.

PL-300 Exam Question 2
You have the line chart shown in the exhibit. (Click the Exhibit tab.)
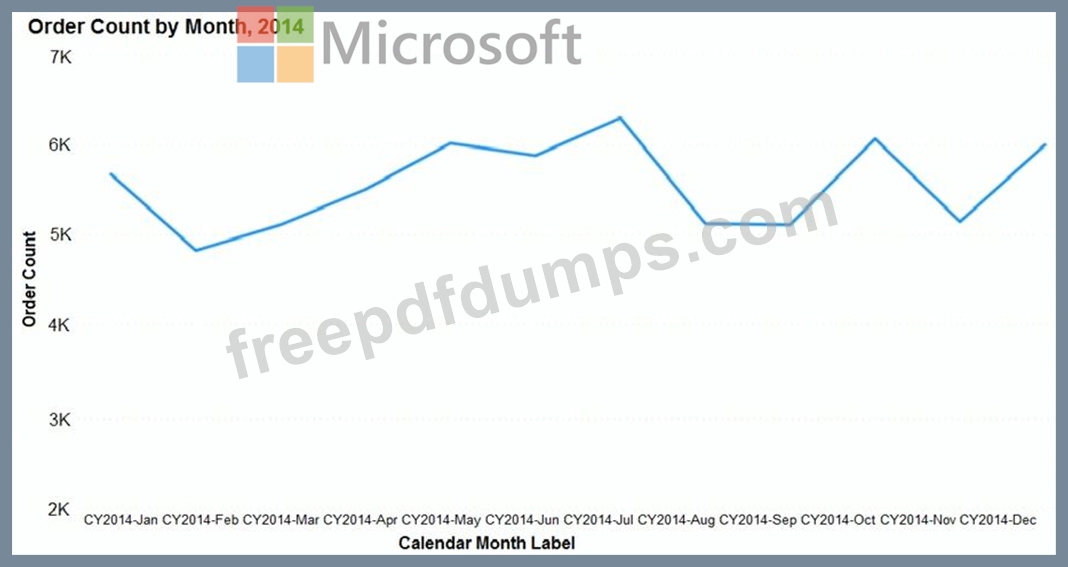
You need to modify the chart to meet the following requirements:
Identify months that have order counts above the mean.
Display the mean monthly order count.
Which three actions should you perform in sequence? To answer, move the appropriate actions from the list of actions to the answer area and arrange them in the correct order.
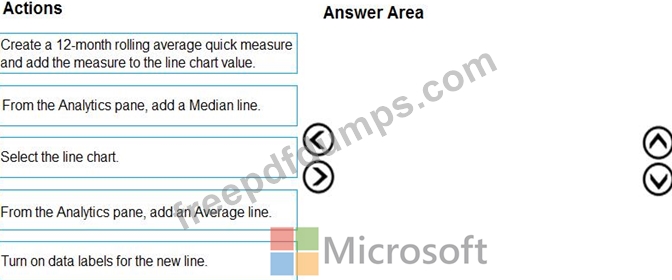

PL-300 Exam Question 3
You create a data model in Power BI.
Report developers and users provide feedback that the data model is too complex.
The model contains the following tables.
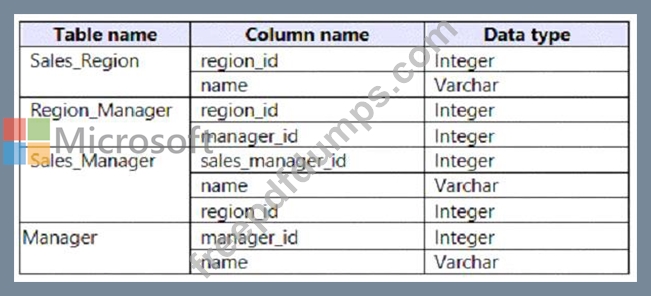
The model has the following relationships:
*There is a one-to-one relationship between Sales_Region and Region_Manager.
*There are more records in Manager than in Region_Manager, but every record in Region_Manager has a corresponding record in Manager.
*There are more records in Sales_Manager than in Sales_Region, but every record in Sales_Region has a corresponding record in Sales_Manager.
You need to denormalize the model into a single table. Only managers who are associated to a sales region must be included in the reports.
Which three actions should you perform in sequence? To answer, move the appropriate actions from the list of actions to the answer area and arrange them in the correct order.
NOTE: More than one order of answer choices is correct. You will receive credit for any of the correct orders you select.
Report developers and users provide feedback that the data model is too complex.
The model contains the following tables.
The model has the following relationships:
*There is a one-to-one relationship between Sales_Region and Region_Manager.
*There are more records in Manager than in Region_Manager, but every record in Region_Manager has a corresponding record in Manager.
*There are more records in Sales_Manager than in Sales_Region, but every record in Sales_Region has a corresponding record in Sales_Manager.
You need to denormalize the model into a single table. Only managers who are associated to a sales region must be included in the reports.
Which three actions should you perform in sequence? To answer, move the appropriate actions from the list of actions to the answer area and arrange them in the correct order.
NOTE: More than one order of answer choices is correct. You will receive credit for any of the correct orders you select.

PL-300 Exam Question 4
You import two Microsoft Excel tables named Customer and Address into Power Query. Customer contains the following columns:
* Customer ID
* Customer Name
* Phone
* Email Address
* Address ID
Address contains the following columns:
* Address ID
* Address Line 1
* Address Line 2
* City
* State/Region
* Country
* Postal Code
The Customer ID and Address ID columns represent unique rows.
You need to create a query that has one row per customer. Each row must contain City, State/Region, and Country for each customer.
What should you do?
PL-300 Exam Question 5
You need to create a visualization to meet the reporting requirements of the sales managers.
HOW Should create the Visualization? TO answer, select the appropriate options in the answer area.
HOW Should create the Visualization? TO answer, select the appropriate options in the answer area.
