
PL-300 Exam Question 96
You have a Power Bl report for the marketing department. The report reports on web traffic to a blog and contains data from the following tables.

There is a one-to-many relationship from Posts to Traffic that uses the URL and URL Visited columns. The report contains the visuals shown in the following table.

The dataset takes a long time to refresh.
You need to modify Posts and Traffic queries to reduce toad times.
Which two actions will reduce the toad times? Each correct answer presents part of the solution.
NOTE: Each correct selection is worth one point.
There is a one-to-many relationship from Posts to Traffic that uses the URL and URL Visited columns. The report contains the visuals shown in the following table.
The dataset takes a long time to refresh.
You need to modify Posts and Traffic queries to reduce toad times.
Which two actions will reduce the toad times? Each correct answer presents part of the solution.
NOTE: Each correct selection is worth one point.
PL-300 Exam Question 97
Note: This question is a part of a series of questions that present the same scenario. For your convenience, the scenario is repeated in each question. Each question presents a different goal and answer choices, but the text of the scenario is exactly the same in each question in this series.
Start of repeated scenario
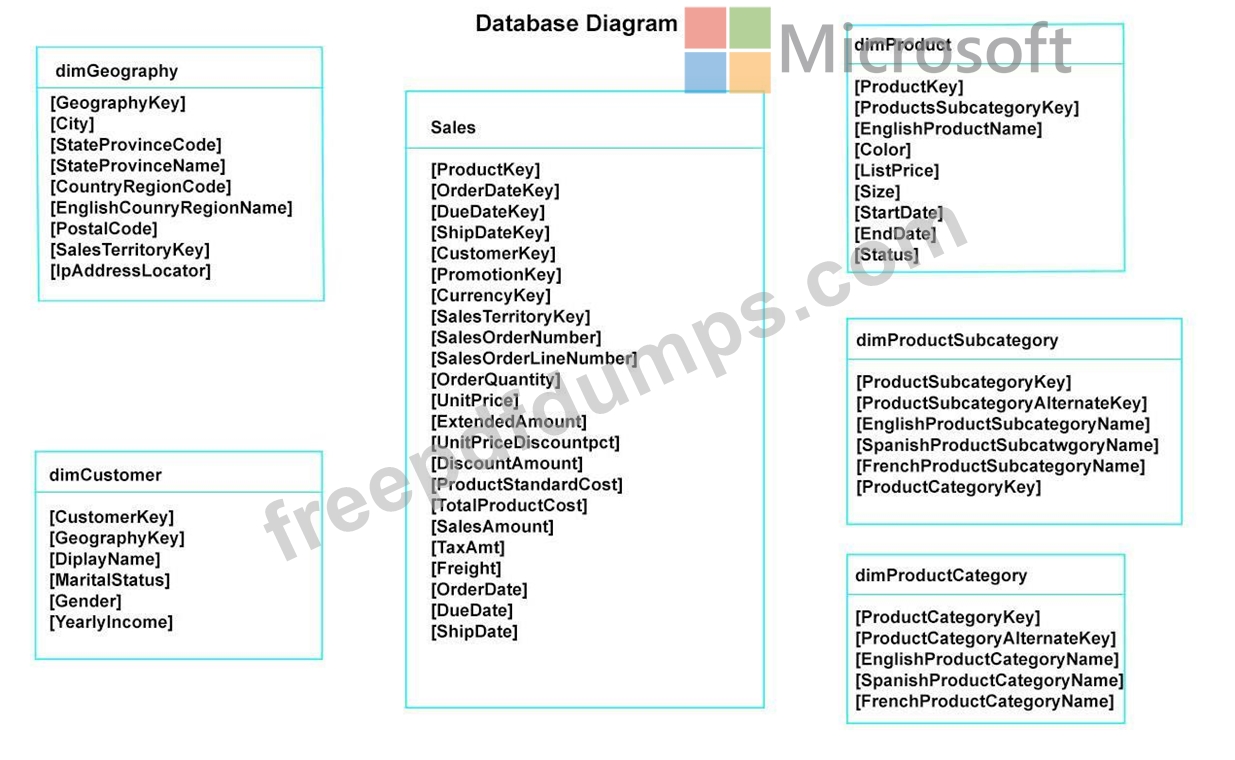
You have a Microsoft SQL Server database that has the tables shown in the Database Diagram exhibit. (Click the Exhibit.)
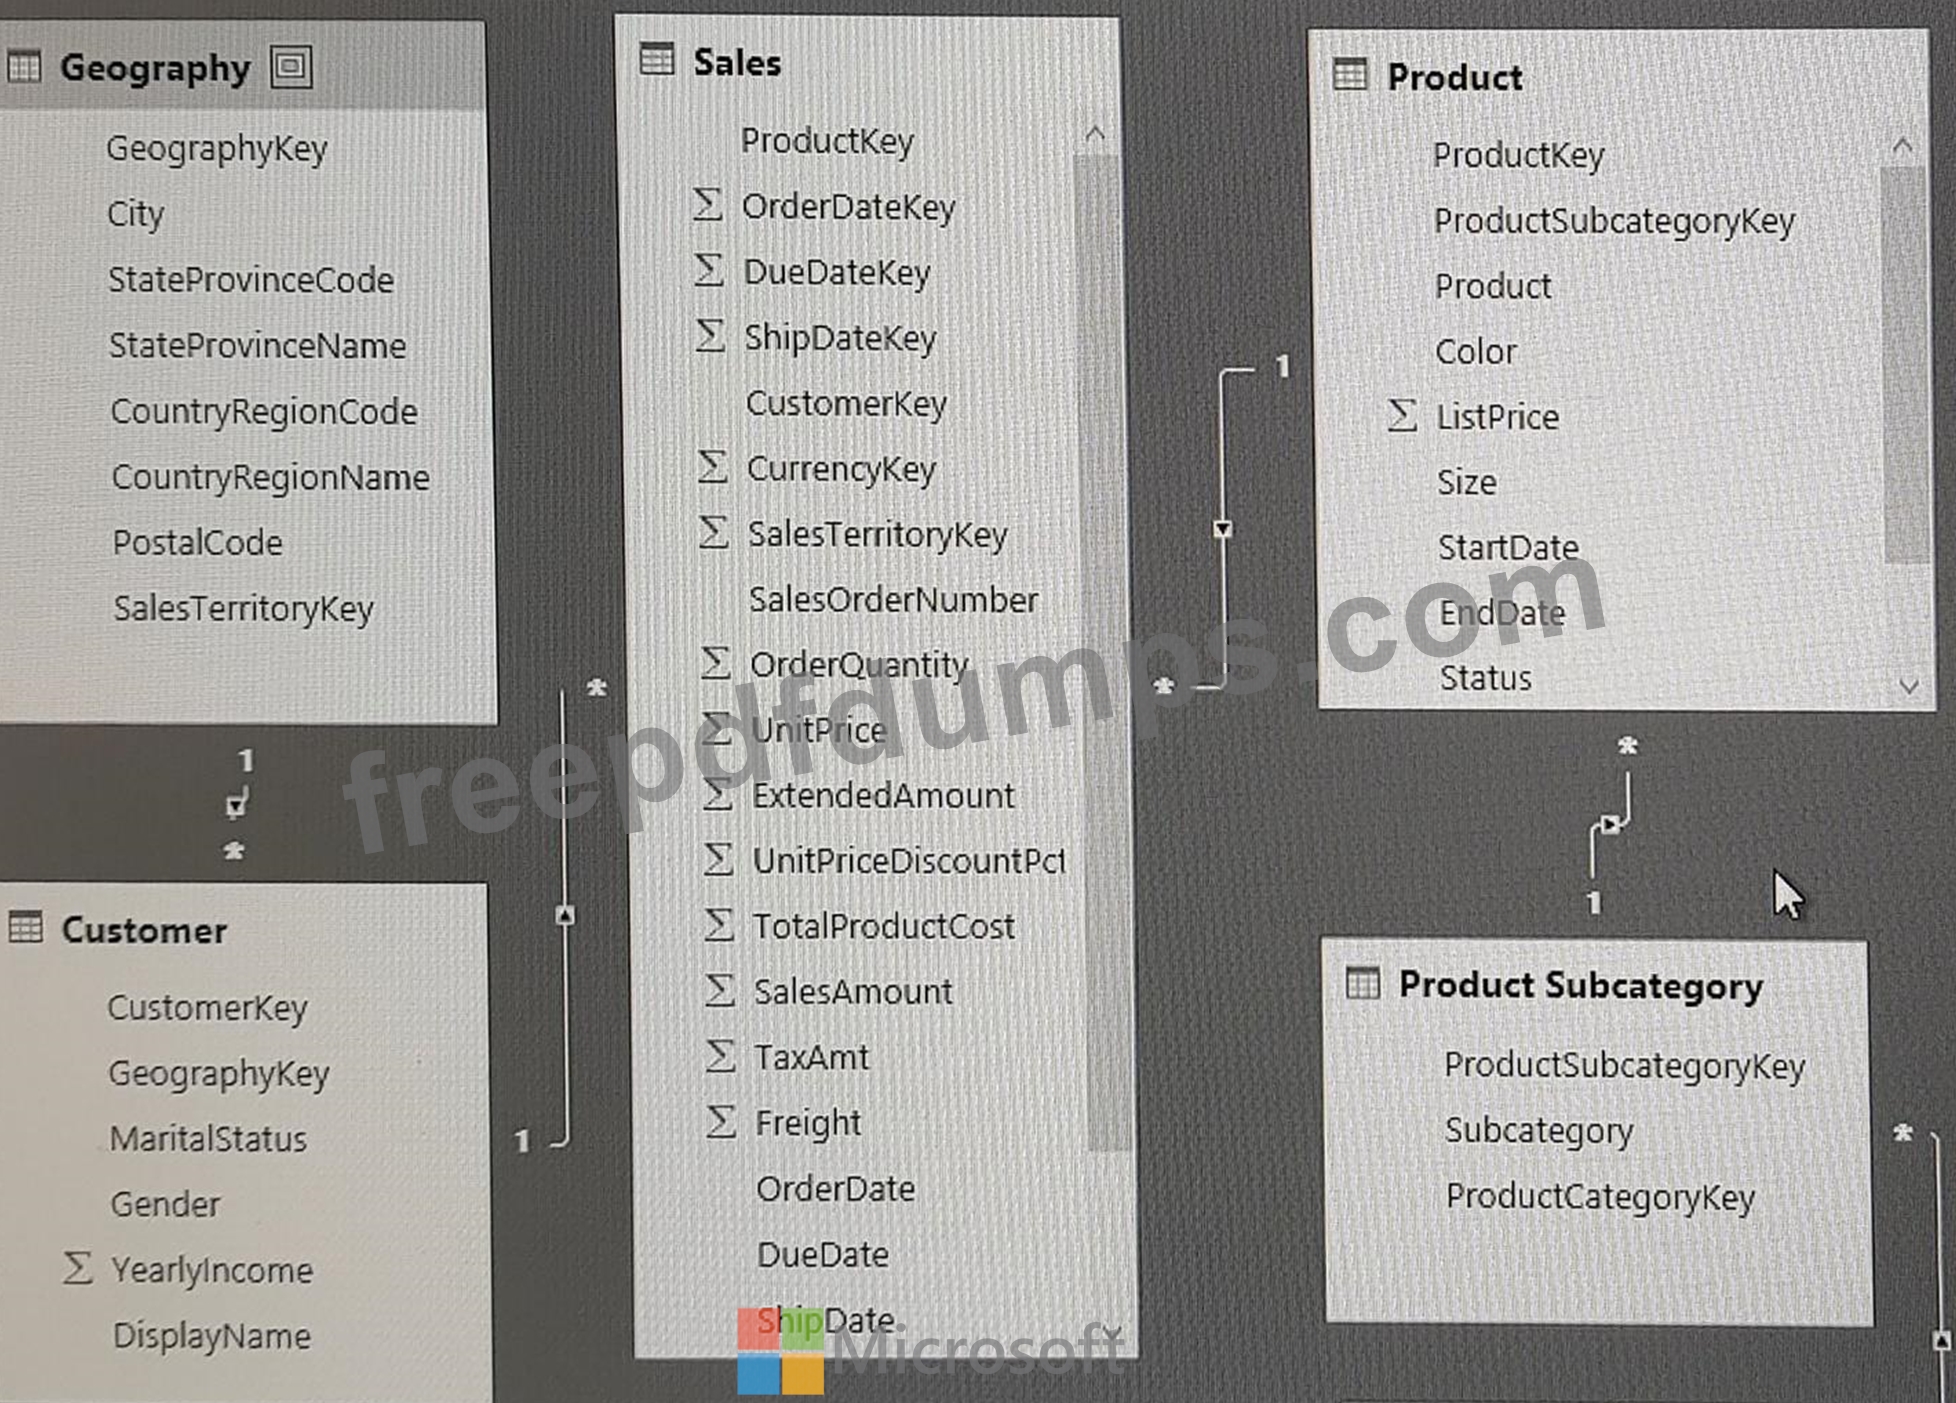
You plan to develop a Power BI model as shown in the Power BI Model exhibit. (Click the Exhibit).
You plan to use Power BI to import data from 2013 to 2015.
Product Subcategory [Subcategory] contains NULL values.
End of repeated scenario.
You implement the Power BI model.
You need to add a measure to rank total sales by product. The results must appear as shown in the following table.

Which DAX formula should you use?
Start of repeated scenario
You have a Microsoft SQL Server database that has the tables shown in the Database Diagram exhibit. (Click the Exhibit.)
You plan to develop a Power BI model as shown in the Power BI Model exhibit. (Click the Exhibit).
You plan to use Power BI to import data from 2013 to 2015.
Product Subcategory [Subcategory] contains NULL values.
End of repeated scenario.
You implement the Power BI model.
You need to add a measure to rank total sales by product. The results must appear as shown in the following table.
Which DAX formula should you use?
PL-300 Exam Question 98
You have a Power BI model that contains a table named Sales and a related date table. Sales contains a measure named Total Sales You need to create a measure that calculates the total sales from the equivalent month of the previous year.
How should you complete the calculation? To answer, select the appropriate options in the answer area NOTE: Each correct selection is worth one point.

How should you complete the calculation? To answer, select the appropriate options in the answer area NOTE: Each correct selection is worth one point.

PL-300 Exam Question 99
You publish a Microsoft Power BI dataset to powerbi.com. The dataset appends data from an on-premises Oracle database and an Azure SQL database by using one query.
You have admin access to the workspace and permission to use an existing On-premises data gateway for which the Oracle data source is already configured.
You need to ensure that the data is updated every morning. The solution must minimize configuration effort.
Which two actions should you perform when you configure scheduled refresh? Each correct answer presents part of the solution.
NOTE: Each correct selection is worth one point.
PL-300 Exam Question 100
You have the Power BI data model shown in the following exhibit.

Use the drop-down menus to select the answer choice that completes each statement based on the information presented in the graphic.
NOTE: Each correct selection is worth one point.

Use the drop-down menus to select the answer choice that completes each statement based on the information presented in the graphic.
NOTE: Each correct selection is worth one point.
