
Analytics-DA-201 Exam Question 46
You plan to create a visualization that has a dual axis chart. The dual axis chart will contain a shape chart and a line chart will use the same measure named Population on the axis.
You need to configure be shapes to be much larger than the line.
What should you do?
You need to configure be shapes to be much larger than the line.
What should you do?
Analytics-DA-201 Exam Question 47
Open the link to Book1 found on the desktop. Open SalesVSProfit worksheet.
Add a distribution band on Profit to show the standard deviation from- 1 to 1.

Add a distribution band on Profit to show the standard deviation from- 1 to 1.
Analytics-DA-201 Exam Question 48
You have the following visualization.


Analytics-DA-201 Exam Question 49
A Data Analyst needs to analyze the financial performance of the sales team. In order to make the dashboards easier to understand, the analyst needs to format the financial values to show the dollar symbol ($) in front of the value.
How should the analyst enable this formatting across the workbook?
How should the analyst enable this formatting across the workbook?
Analytics-DA-201 Exam Question 50
You have a data set that contains three columns named Sales, Profit, and Quantity.
You need to build the following scatter plot.
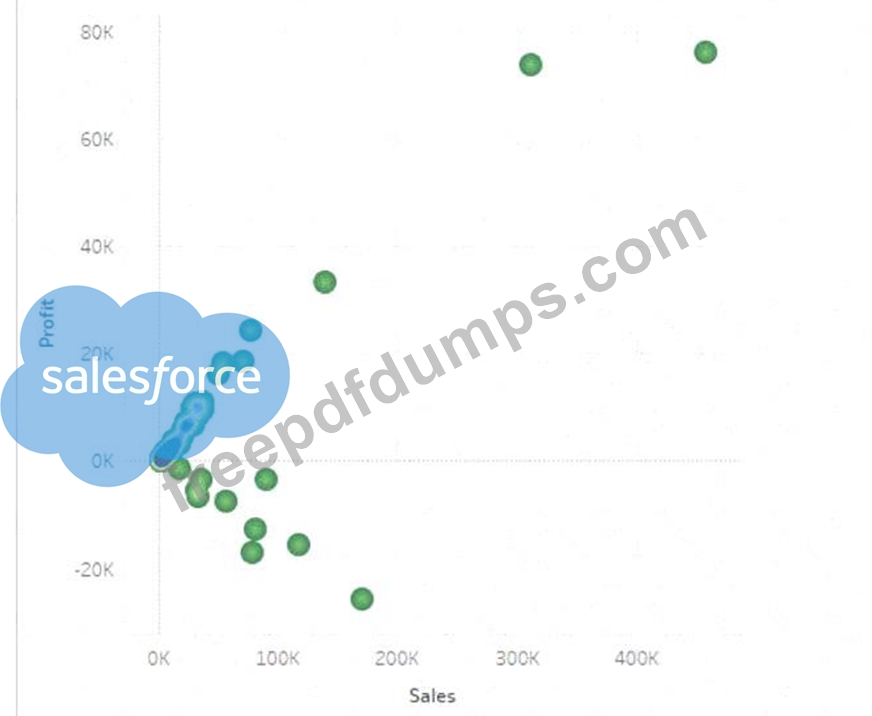

You need to build the following scatter plot.

