DA-100 Exam Question 121
You need to create a visual as shown in the following exhibit.
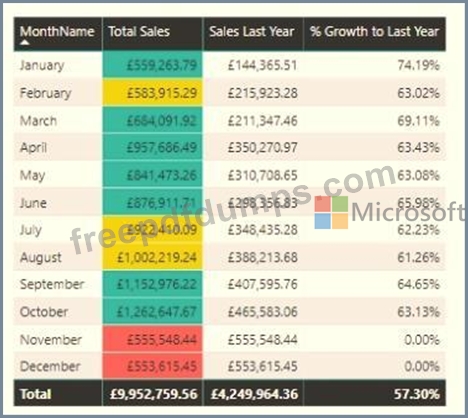
The indicator color for Total Sales will be based on % Growth to Last Year.
The solution must use the existing calculations only.
How should you configure the visual? To answer, select the appropriate options in the answer area.
NOTE: Each correct selection is worth one point.


The indicator color for Total Sales will be based on % Growth to Last Year.
The solution must use the existing calculations only.
How should you configure the visual? To answer, select the appropriate options in the answer area.
NOTE: Each correct selection is worth one point.

DA-100 Exam Question 122
Note: This question is part of a series of questions that present the same scenario. Each question in the series contains a unique solution that might meet the stated goals. Some question sets might have more than one correct solution, while others might not have a correct solution.
After you answer a question in this section, you will NOT be able to return to it. As a result, these questions will not appear in the review screen.
You are modeling data by using Microsoft Power Bl. Part of the data model is a large Microsoft SQL Server table named Order that has more than 100 million records.
During the development process, you need to import a sample of the data from the Order table.
Solution: You write a DAX expression that uses the FILTER function.
Does this meet the goal?
DA-100 Exam Question 123
Your company has affiliates who help the company acquire customers.
You build a report for the affiliate managers at the company to assist them in understanding affiliate performance.
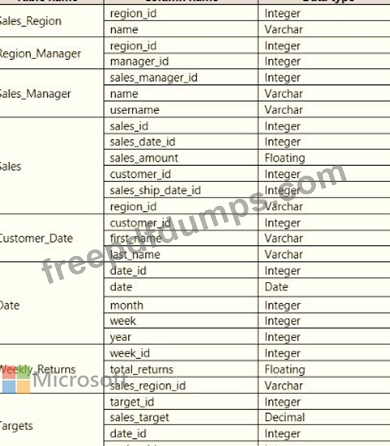
The managers request a visual showing the total sales value of the latest 50 transactions for each affiliate. You have a data model that contains the following tables.

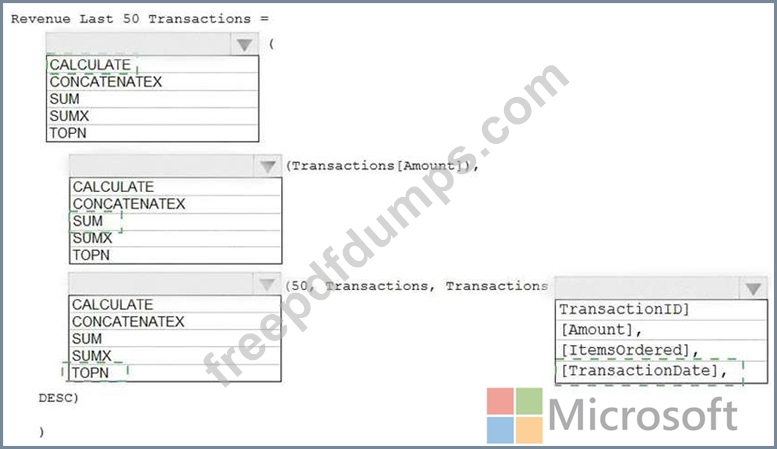
You need to develop a measure to support the visual.
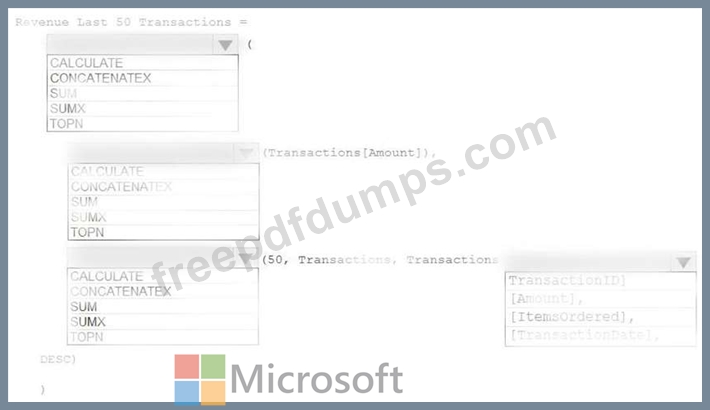
How should you complete the DAX expression? To answer, select the appropriate options in the answer area.
NOTE: Each correct selection is worth one point.
You build a report for the affiliate managers at the company to assist them in understanding affiliate performance.
The managers request a visual showing the total sales value of the latest 50 transactions for each affiliate. You have a data model that contains the following tables.

You need to develop a measure to support the visual.
How should you complete the DAX expression? To answer, select the appropriate options in the answer area.
NOTE: Each correct selection is worth one point.

DA-100 Exam Question 124
You have a Power BI model for sales data. You create a measure to calculate the year-to-date sales.
You need to compare the year-to-date sales with the previous year for the same time period.
Which DAX function should you use?
You need to compare the year-to-date sales with the previous year for the same time period.
Which DAX function should you use?
DA-100 Exam Question 125
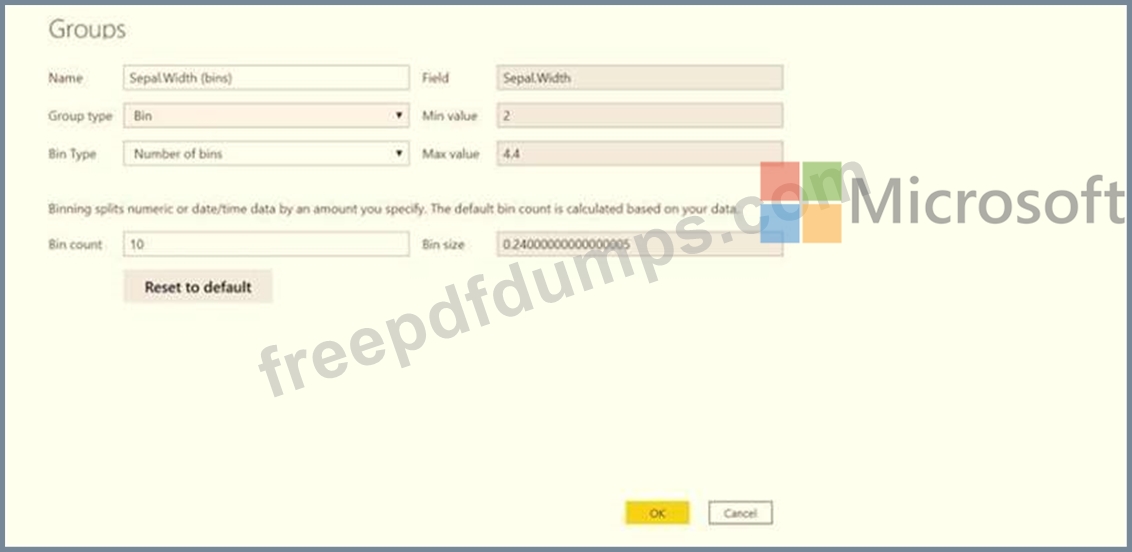
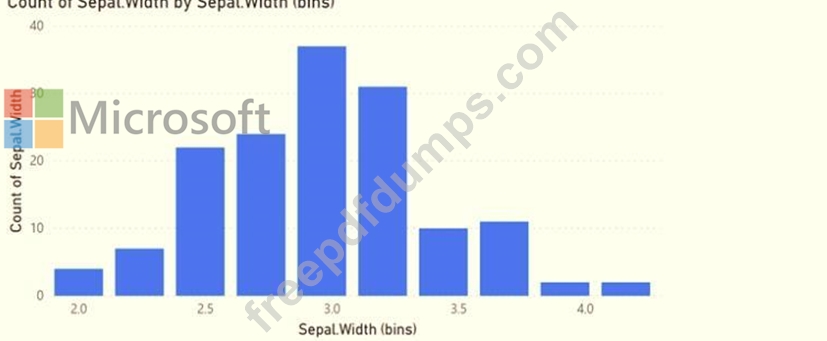
You are creating a column chart visualization.
You configure groups as shown in the Groups exhibit. {Click the Groups tab.)
The visualization appears as shown in the Chart exhibit. (Click the Chart tab.)
For each of the following statements, select Yes if the statement is true. Otherwise, select No.
NOTE: Each correct selection is worth one point.

You configure groups as shown in the Groups exhibit. {Click the Groups tab.)

The visualization appears as shown in the Chart exhibit. (Click the Chart tab.)

For each of the following statements, select Yes if the statement is true. Otherwise, select No.
NOTE: Each correct selection is worth one point.

Premium Bundle
Newest DA-100 Exam PDF Dumps shared by Actual4test.com for Helping Passing DA-100 Exam! Actual4test.com now offer the updated DA-100 exam dumps, the Actual4test.com DA-100 exam questions have been updated and answers have been corrected get the latest Actual4test.com DA-100 pdf dumps with Exam Engine here:
(150 Q&As Dumps, 30%OFF Special Discount: Freepdfdumps)


