

DA-100 Exam Question 6
You build a report to analyze customer transactions from a database that contains the tables shown in the following table.

You import the tables.
Which relationship should you use to link the tables?
You import the tables.
Which relationship should you use to link the tables?
DA-100 Exam Question 7
You have the tables shown in the following table.
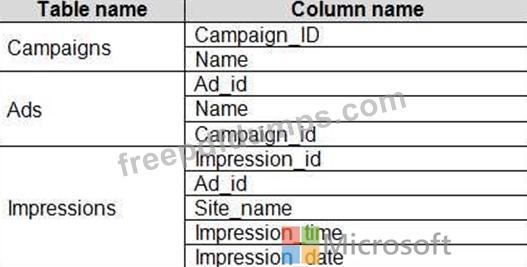
The Impressions table contains approximately 30 million records per month.
You need to create an ad analytics system to meet the following requirements:
* Present ad impression counts for the day, campaign, and Site_name. The analytics for the last year are required.
* Minimize the data model size.
Which two actions should you perform? Each correct answer presents part of the solution.
NOTE: Each correct selection is worth one point.
The Impressions table contains approximately 30 million records per month.
You need to create an ad analytics system to meet the following requirements:
* Present ad impression counts for the day, campaign, and Site_name. The analytics for the last year are required.
* Minimize the data model size.
Which two actions should you perform? Each correct answer presents part of the solution.
NOTE: Each correct selection is worth one point.
DA-100 Exam Question 8
You have a folder of monthly transaction extracts.
You plan to create a report to analyze the transaction data.
You receive the following email message: "Hi. I've put 24 files of monthly transaction data onto the shared drive. File Transactions201901.csv through Transactions201912.csv have the latest set of columns, but files Transactions201801.csv to Transactions201812.csv have an older layout without the extra fields needed for analysis. Each file contains 10 to 50 transactions." You get data from the folder and select Combine & Load. The Combine Files dialog box is shown in the exhibit. (Click the Exhibit tab.)
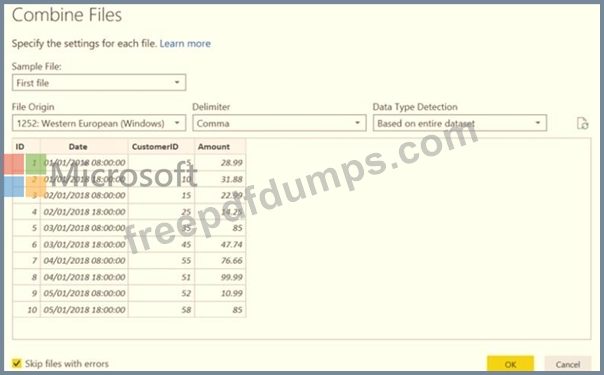
For each of the following statements, select Yes if the statement is true. Otherwise, select No.
NOTE: Each correct selection is worth one point.

You plan to create a report to analyze the transaction data.
You receive the following email message: "Hi. I've put 24 files of monthly transaction data onto the shared drive. File Transactions201901.csv through Transactions201912.csv have the latest set of columns, but files Transactions201801.csv to Transactions201812.csv have an older layout without the extra fields needed for analysis. Each file contains 10 to 50 transactions." You get data from the folder and select Combine & Load. The Combine Files dialog box is shown in the exhibit. (Click the Exhibit tab.)
For each of the following statements, select Yes if the statement is true. Otherwise, select No.
NOTE: Each correct selection is worth one point.

DA-100 Exam Question 9
You have a Power BI Desktop project that uses DirectQuery to access an on-premises Microsoft SQL Server database.
From Power BI Desktop, you can query the database.
When you publish the Power BI Desktop project to the Power BI service, the visualizations cannot display the data.
What should you do to resolve the issue?
From Power BI Desktop, you can query the database.
When you publish the Power BI Desktop project to the Power BI service, the visualizations cannot display the data.
What should you do to resolve the issue?
DA-100 Exam Question 10
You plan to create the chart shown in the following exhibit.

How should you create the dashed horizontal line denoting the 40th percentile of daily sales for the period shown?
How should you create the dashed horizontal line denoting the 40th percentile of daily sales for the period shown?