DA-100 Exam Question 21
You have the visual shown in the exhibit. (Click the Exhibit tab.)
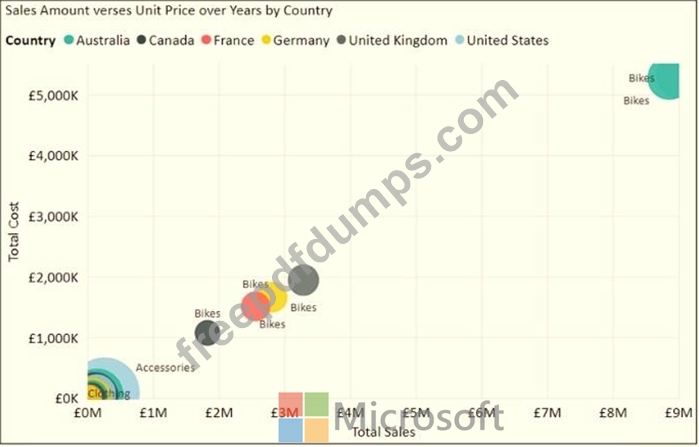
You need to show the relationship between Total Cost and Total Sales over time.
What should you do?
You need to show the relationship between Total Cost and Total Sales over time.
What should you do?
DA-100 Exam Question 22
You receive revenue data that must be included in Microsoft Power Bl reports.
You perform an initial load of the data from a Microsoft Excel source as shown in the following exhibit.
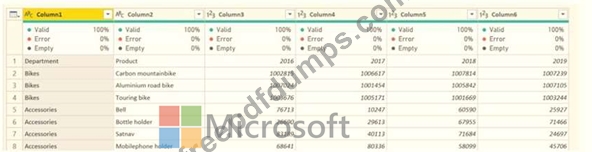
You plan to create several visuals from the data, including a visual that shows revenue split by year and product.
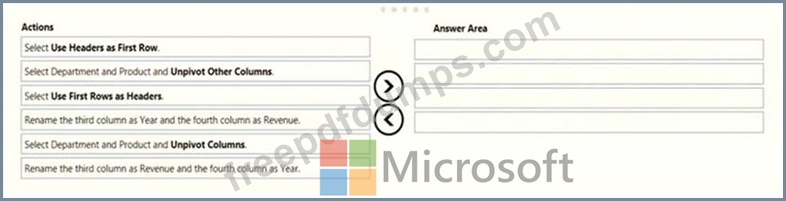
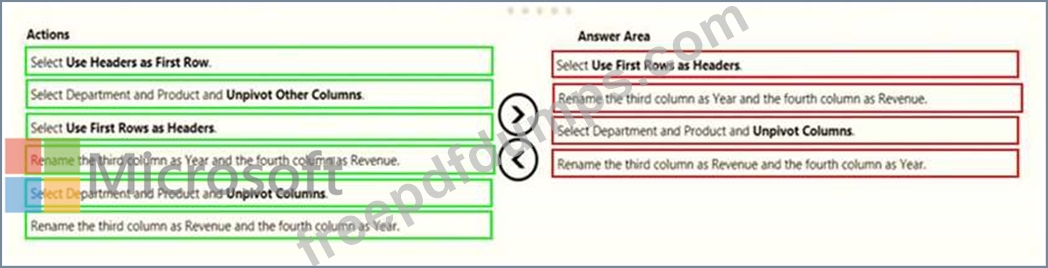
You need to transform the data to ensure that you can build the visuals. The solution must ensure that the columns are named appropriately for the data that they contain.
You perform an initial load of the data from a Microsoft Excel source as shown in the following exhibit.
You plan to create several visuals from the data, including a visual that shows revenue split by year and product.
You need to transform the data to ensure that you can build the visuals. The solution must ensure that the columns are named appropriately for the data that they contain.
DA-100 Exam Question 23
You create a dashboard by using the Microsoft Power Bl Service. The dashboard contains a card visual that shows total sales from the current year.
You grant users access to the dashboard by using the viewer role on the workspace.
A user wants to receive daily notifications of the number shown on the card visual.
You need to automate the notifications.
What should you do?
You grant users access to the dashboard by using the viewer role on the workspace.
A user wants to receive daily notifications of the number shown on the card visual.
You need to automate the notifications.
What should you do?
DA-100 Exam Question 24
You have the dataset shown in the following exhibit.
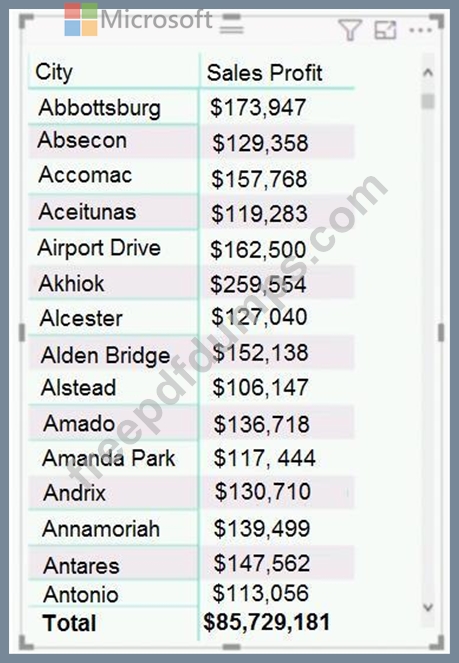
You need to ensure that the visual shows only the 10 cities that have the highest sales profit.
What should you do?
You need to ensure that the visual shows only the 10 cities that have the highest sales profit.
What should you do?
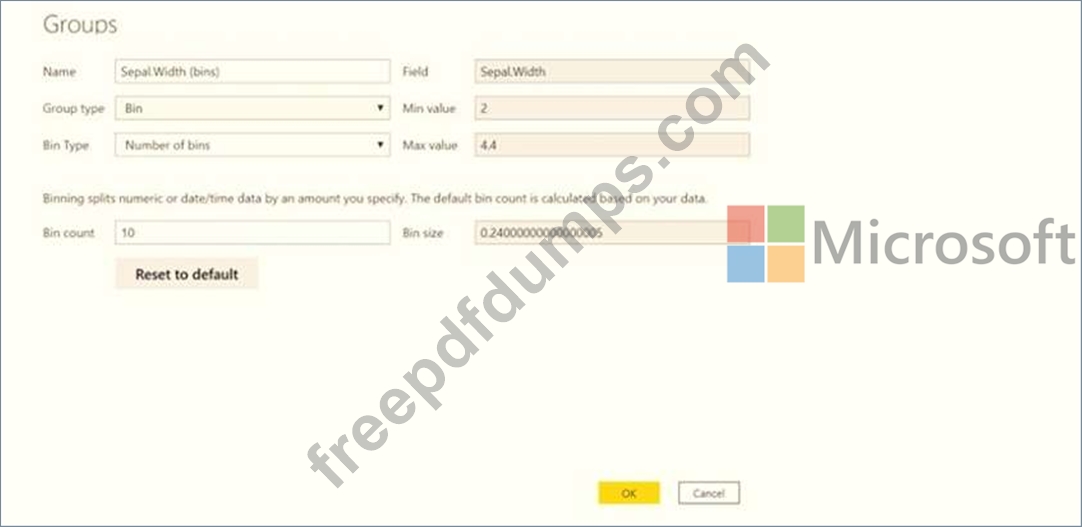
DA-100 Exam Question 25
You are creating a column chart visualization.
You configure groups as shown in the Groups exhibit. {Click the Groups tab.)
The visualization appears as shown in the Chart exhibit. (Click the Chart tab.)
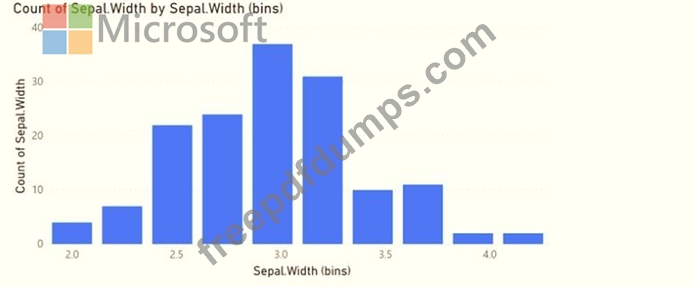
For each of the following statements, select Yes if the statement is true. Otherwise, select No.
NOTE: Each correct selection is worth one point.

You configure groups as shown in the Groups exhibit. {Click the Groups tab.)
The visualization appears as shown in the Chart exhibit. (Click the Chart tab.)
For each of the following statements, select Yes if the statement is true. Otherwise, select No.
NOTE: Each correct selection is worth one point.