

Applied-Algebra Exam Question 1
The graph shows the progress of a manufacturing team, modeling the number of widgets the team is able to produce each day since the team was formed.

How should the average rate of change from day 20 to day 26 be interpreted?
How should the average rate of change from day 20 to day 26 be interpreted?
Applied-Algebra Exam Question 2
The population of bison in a preserve can be modeled using the logistic function f(x), where x represents the number of years since the preserve was established and f(x) represents the population. The graph of f(x) is shown.

How does the bison population change as time progresses from year 7 to year 10?
How does the bison population change as time progresses from year 7 to year 10?
Applied-Algebra Exam Question 3
The graphed function v(t) represents the number of vehicles, v, stopped at a toll booth t hours after 6:00 a.m.
The coordinates of points A and B are (1,49.4) and (4,45.8), respectively.

What is the average rate of change of the number of vehicles from point A to point B?
The coordinates of points A and B are (1,49.4) and (4,45.8), respectively.
What is the average rate of change of the number of vehicles from point A to point B?
Applied-Algebra Exam Question 4
The function P(t)represents the daily profit, in hundreds of dollars, for a museum since opening. The graph of P(t)is shown.
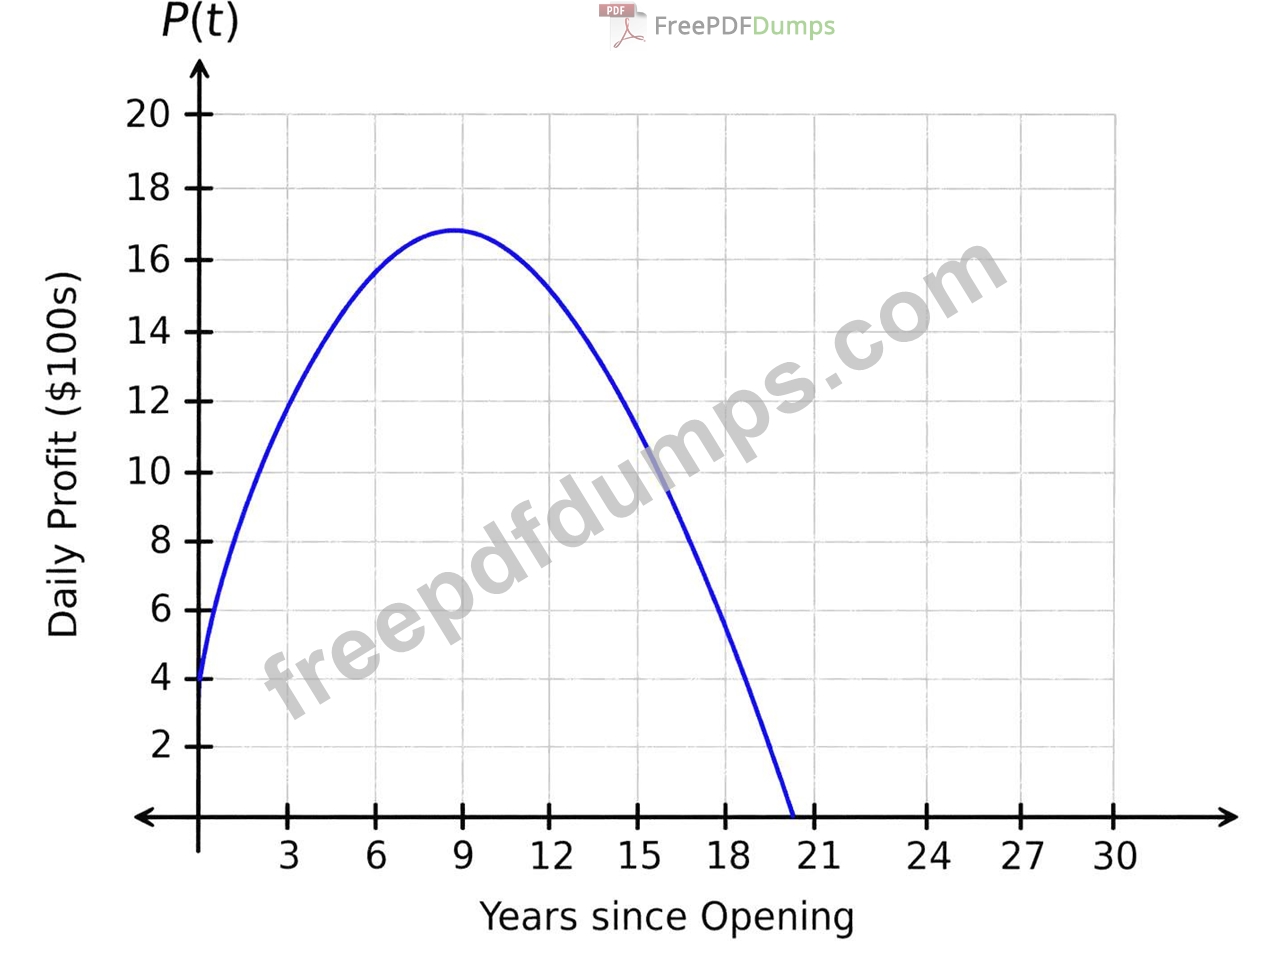
What is the correct interpretation of the maximum value?
What is the correct interpretation of the maximum value?
Applied-Algebra Exam Question 5
The exponential function
f(t)=2900(1.13)
t
represents the size of a bacteria population, where t is the time in hours.
How many bacteria are in the population when t=18?
f(t)=2900(1.13)
t
represents the size of a bacteria population, where t is the time in hours.
How many bacteria are in the population when t=18?