DA-100 Exam Question 11
You create a dataset sourced from dozens of flat files in Azure Blob storage. The dataset uses incremental refresh.
From powerbi.com, you deploy the dataset and several related reports to Microsoft Power BI Premium capacity.
You discover that the dataset refresh fails after the refresh runs out of resources.
What is a possible cause of the issue?
From powerbi.com, you deploy the dataset and several related reports to Microsoft Power BI Premium capacity.
You discover that the dataset refresh fails after the refresh runs out of resources.
What is a possible cause of the issue?
DA-100 Exam Question 12
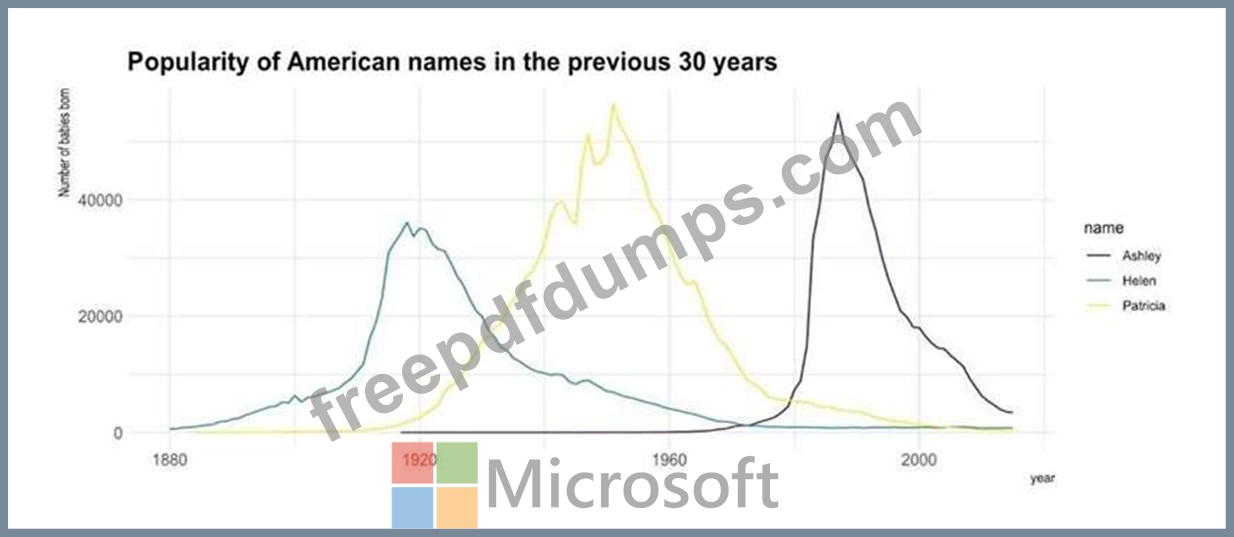
You need to create a visualization to meet the reporting requirements of the sales managers.
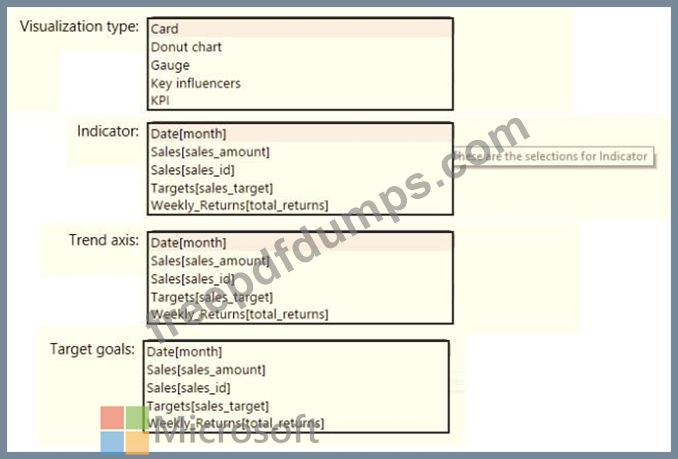
How should you create the visualization? To answer, select the appropriate options in the answer area.
NOTE: Each correct selection is worth one point.
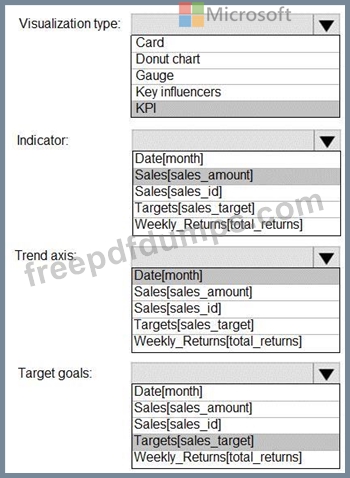
How should you create the visualization? To answer, select the appropriate options in the answer area.
NOTE: Each correct selection is worth one point.

DA-100 Exam Question 13
You create a dataset sourced from dozens of flat files in Azure Blob storage. The dataset uses incremental refresh.
From powerbi.com, you deploy the dataset and several related reports to Microsoft Power BI Premium capacity.
You discover that the dataset refresh fails after the refresh runs out of resources.
What is a possible cause of the issue?
From powerbi.com, you deploy the dataset and several related reports to Microsoft Power BI Premium capacity.
You discover that the dataset refresh fails after the refresh runs out of resources.
What is a possible cause of the issue?
DA-100 Exam Question 14
You have a table that contains the following three columns:
City
Total Sales
Occupation
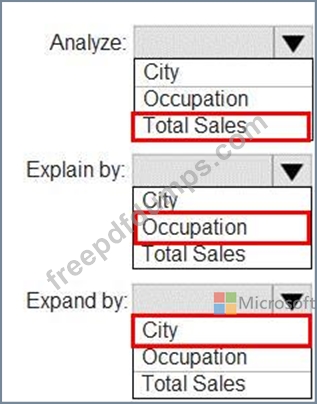
You need to create a key influencers visualization as shown in the exhibit. (Click the Exhibit tab.)
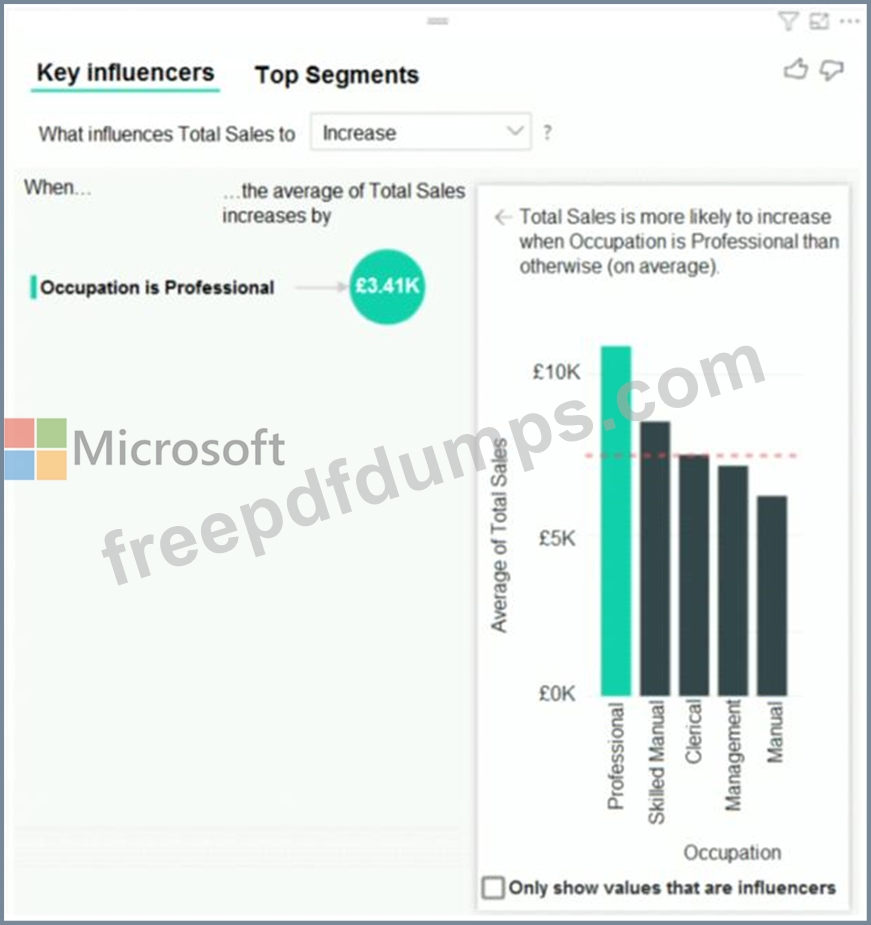
How should you configure the visualization? To answer, select the appropriate options in the answer area.
NOTE: Each correct selection is worth one point.
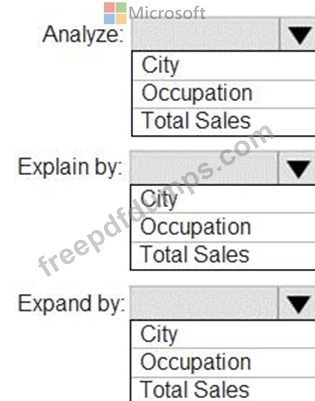
City
Total Sales
Occupation
You need to create a key influencers visualization as shown in the exhibit. (Click the Exhibit tab.)
How should you configure the visualization? To answer, select the appropriate options in the answer area.
NOTE: Each correct selection is worth one point.
DA-100 Exam Question 15
You need to create a visualization that compares revenue and cost over time.
Which type of visualization should you use?
Which type of visualization should you use?