
DA-100 Exam Question 26
You have a Microsoft Power Bl workspace.
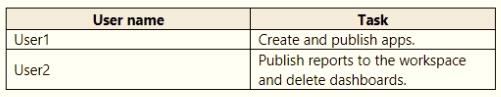
You need to grant the user capabilities shown in the following table.
The solution must use the principle of least privilege.
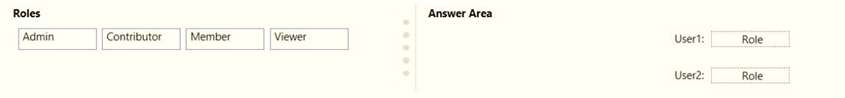
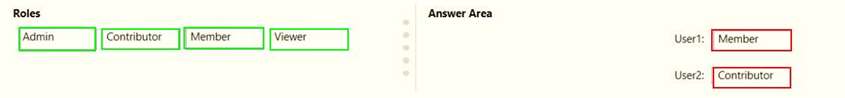
Which user role should you assign to each user? To answer, drag the appropriate roles to the correct users. Each role may be used once, more than once, or not at all. You may need to drag the split bar between panes or scroll to view content.
NOTE: Each correct selection is worth one point.
You need to grant the user capabilities shown in the following table.
The solution must use the principle of least privilege.
Which user role should you assign to each user? To answer, drag the appropriate roles to the correct users. Each role may be used once, more than once, or not at all. You may need to drag the split bar between panes or scroll to view content.
NOTE: Each correct selection is worth one point.
DA-100 Exam Question 27
You create a dashboard by using the Microsoft Power Bl Service. The dashboard contains a card visual that shows total sales from the current year. You grant users access to the dashboard by using the viewer role on the workspace. A user wants to receive daily notifications of the number shown on the card visual. You need to automate the notifications. What should you do?
DA-100 Exam Question 28
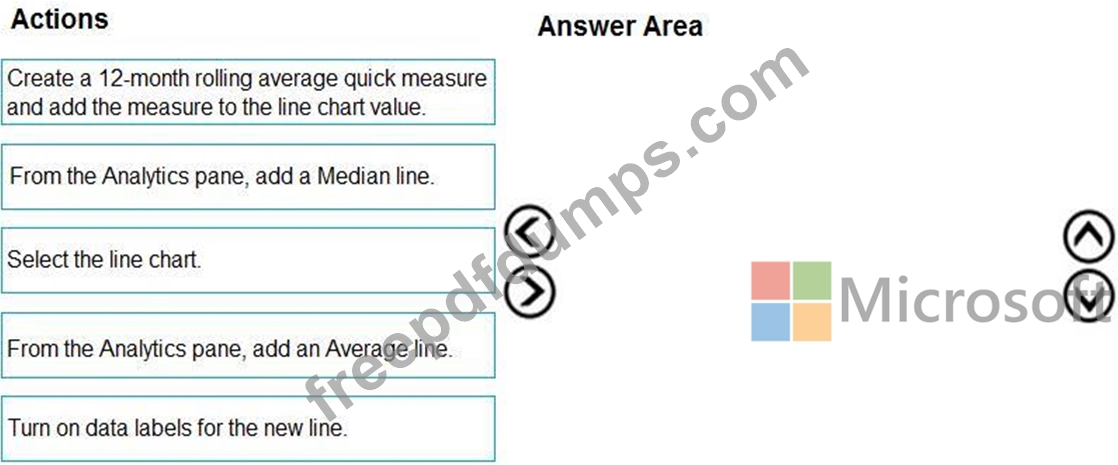
You have the line chart shown in the exhibit. (Click the Exhibit tab.)
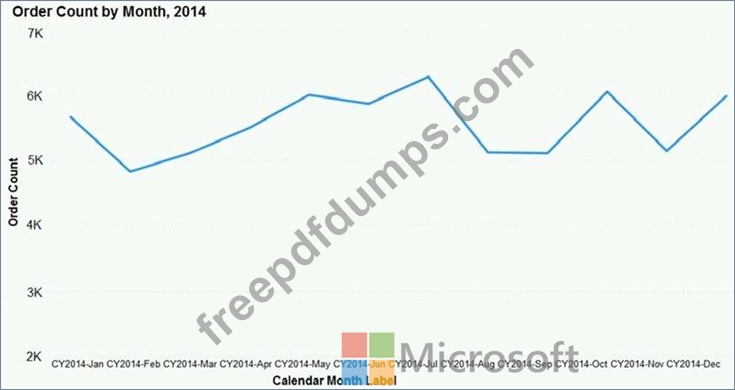
You need to modify the chart to meet the following requirements:
* Identify months that have order counts above the mean.
* Display the mean monthly order count.
Which three actions should you perform in sequence? To answer, move the appropriate actions from the list of actions to the answer area and arrange them in the correct order.
DA-100 Exam Question 29
You have multiple dashboards.
You need to ensure that when users browse the available dashboards from powerbi.com. they can see which dashboards contain Personally Identifiable Information (Pll). The solution must minimize configuration effort and impact on the dashboard design.
What should you use?
You need to ensure that when users browse the available dashboards from powerbi.com. they can see which dashboards contain Personally Identifiable Information (Pll). The solution must minimize configuration effort and impact on the dashboard design.
What should you use?
DA-100 Exam Question 30
Case Study 1 - Litware, Inc.
Overview
Litware, Inc. is an online retailer that uses Microsoft Power Bl dashboards and reports. The company plans to leverage data from Microsoft SQL Server databases, Microsoft Excel files, text files, and several other data sources.
Litware uses Azure Active Directory (Azure AD) to authenticate users.
Existing Environment
Sales Data
Litware has online sales data that has the SQL schema shown in the following table.
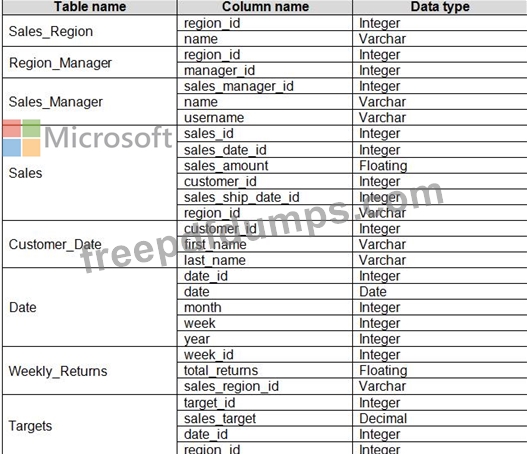
In the Date table, the dateid column has a format of yyyymmdd and the month column has a format of yyyymm. The week column in the Date table and the weekid column in the Weekly_Returns table have a format of yyyyww. The regionid column can be managed by only one sales manager.
Data Concerns
You are concerned with the quality and completeness of the sales data. You plan to verify the sales data for negative sales amounts.
Reporting Requirements
Litware identifies the following technical requirements:
- Executives require a visual that shows sales by region.
- Regional managers require a visual to analyze weekly sales and
returns.
- Sales managers must be able to see the sales data of their respective region only.
- The sales managers require a visual to analyze sales performance
versus sales targets.
- The sale department requires reports that contain the number of sales transactions.
- Users must be able to see the month in reports as shown in the
following example: Feb 2020.
- The customer service department requires a visual that can be
filtered by both sales month and ship month independently.
You need to create a relationship between the Weekly_Returns table and the Date table to meet the reporting requirements of the regional managers.
What should you do?
Overview
Litware, Inc. is an online retailer that uses Microsoft Power Bl dashboards and reports. The company plans to leverage data from Microsoft SQL Server databases, Microsoft Excel files, text files, and several other data sources.
Litware uses Azure Active Directory (Azure AD) to authenticate users.
Existing Environment
Sales Data
Litware has online sales data that has the SQL schema shown in the following table.
In the Date table, the dateid column has a format of yyyymmdd and the month column has a format of yyyymm. The week column in the Date table and the weekid column in the Weekly_Returns table have a format of yyyyww. The regionid column can be managed by only one sales manager.
Data Concerns
You are concerned with the quality and completeness of the sales data. You plan to verify the sales data for negative sales amounts.
Reporting Requirements
Litware identifies the following technical requirements:
- Executives require a visual that shows sales by region.
- Regional managers require a visual to analyze weekly sales and
returns.
- Sales managers must be able to see the sales data of their respective region only.
- The sales managers require a visual to analyze sales performance
versus sales targets.
- The sale department requires reports that contain the number of sales transactions.
- Users must be able to see the month in reports as shown in the
following example: Feb 2020.
- The customer service department requires a visual that can be
filtered by both sales month and ship month independently.
You need to create a relationship between the Weekly_Returns table and the Date table to meet the reporting requirements of the regional managers.
What should you do?