DA-100 Exam Question 31
You have sales data in a star schema that contains four tables named Sales, Customer, Date, and Product. The Sales table contains purchase and ship dates.
Most often, you will use the purchase date to analyze the data, but you will analyze the data by both dates independently and together.
You need to design an imported dataset to support the analysis. The solution must minimize the model size and the number of queries against the data source.
Which data modeling design should you use?
DA-100 Exam Question 32
Case Study 2 - Contoso Ltd
Overview
Existing Environment
Contoso, Ltd. is a manufacturing company that produces outdoor equipment Contoso has quarterly board meetings for which financial analysts manually prepare Microsoft Excel reports, including profit and loss statements for each of the company's four business units, a company balance sheet, and net income projections for the next quarter.
Data and Sources
Data for the reports comes from three sources. Detailed revenue, cost and expense data comes from an Azure SQL database. Summary balance sheet data comes from Microsoft Dynamics 365 Business Central. The balance sheet data is not related to the profit and loss results, other than they both relate to dates.
Monthly revenue and expense projections for the next quarter come from a Microsoft SharePoint Online list. Quarterly projections relate to the profit and loss results by using the following shared dimensions: date, business unit, department, and product category.
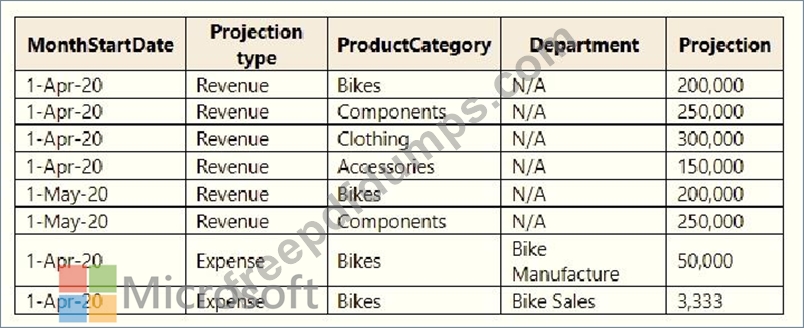
Net Income Projection Data
Net income projection data is stored in a SharePoint Online list named Projections in the format shown in the following table.
Revenue projections are set at the monthly level and summed to show projections for the quarter.
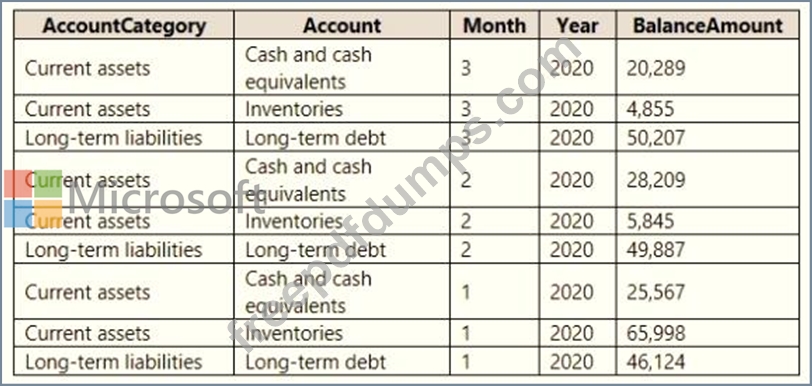
Balance Sheet Data
The balance sheet data is imported with final balances for each account per month in the format shown in the following table.
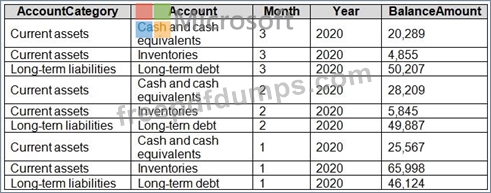
There is always a row for each account for each month in the balance sheet data.
Dynamics 365 Business Central Data
Business Central contains a product catalog that shows how products roll up to product categories, which roll up to business units. Revenue data is provided at the date and product level. Expense data is provided at the date and department level.
Business Issues
Historically, it has taken two analysts a week to prepare the reports for the quarterly board meetings. Also, there is usually at least one issue each quarter where a value in a report is wrong because of a bad cell reference in an Excel formula. On occasion, there are conflicting results in the reports because the products and departments that roll up to each business unit are not defined consistently.
Planned Changes
Contoso plans to automate and standardize the quarterly reporting process by using Microsoft Power Bl. The company wants to how long it takes to populate reports to less than two days. The company wants to create common logic for business units, products, and departments to be used across all reports, including, but not limited, to the quarterly reporting for the board.
Technical Requirements
Contoso wants the reports and datasets refreshed with minimal manual effort The company wants to provide a single package of reports to the board that contains custom navigation and links to supplementary information.
Maintenance, including manually updating data and access, must be minimized as much as possible.
Security Requirements
The reports must be made available to the board from powerbi.com. A mail-enabled security group will be used to share information with the board.
The analysts responsible for each business unit must see all the data the board sees, except the profit and loss data, which must be restricted to only their business unit's data. The analysts must be able to build new reports from the dataset that contains the profit and loss data, but any reports that the analysts build must not be included in the quarterly reports for the board. The analysts must not be able to share the quarterly reports with anyone.
Report Requirements
You plan to relate the balance sheet to a standard date table in Power Bl in a many-to-one relationship based on the last day of the month. At least one of the balance sheet reports in the quarterly reporting package must show the ending balances for the quarter, as well as for the previous quarter.
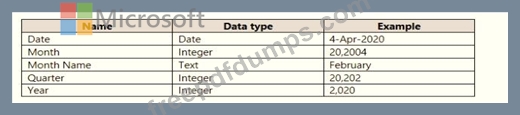
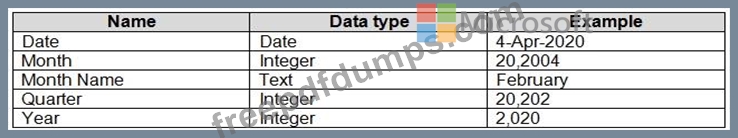
Projections must contain a column named RevenueProjection that contains the revenue projection amounts. A relationship must be created from Projections to a table named Date that contains the columns shown in the following table.
The relationships between products and departments to business units must be consistent across all reports.
The board must be able to get the following information from the quarterly reports:
- Revenue trends over time
- Ending balances for each account
- A comparison of expenses versus projections by quarter
- Changes in long-term liabilities from the previous quarter
- A comparison of quarterly revenue versus the same quarter during the
prior year
Hotspot Question
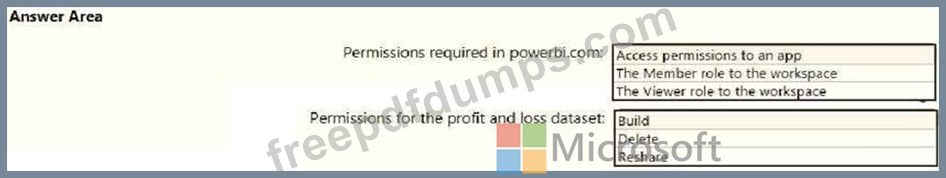
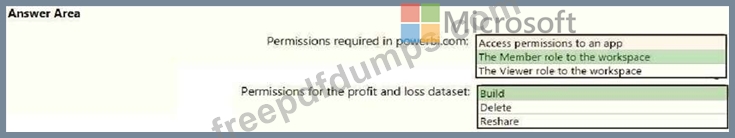
You need to grant access to the business unit analysts.
What should you configure? To answer, select the appropriate options in the answer area. NOTE:
Each correct selection is worth one point.
Overview
Existing Environment
Contoso, Ltd. is a manufacturing company that produces outdoor equipment Contoso has quarterly board meetings for which financial analysts manually prepare Microsoft Excel reports, including profit and loss statements for each of the company's four business units, a company balance sheet, and net income projections for the next quarter.
Data and Sources
Data for the reports comes from three sources. Detailed revenue, cost and expense data comes from an Azure SQL database. Summary balance sheet data comes from Microsoft Dynamics 365 Business Central. The balance sheet data is not related to the profit and loss results, other than they both relate to dates.
Monthly revenue and expense projections for the next quarter come from a Microsoft SharePoint Online list. Quarterly projections relate to the profit and loss results by using the following shared dimensions: date, business unit, department, and product category.
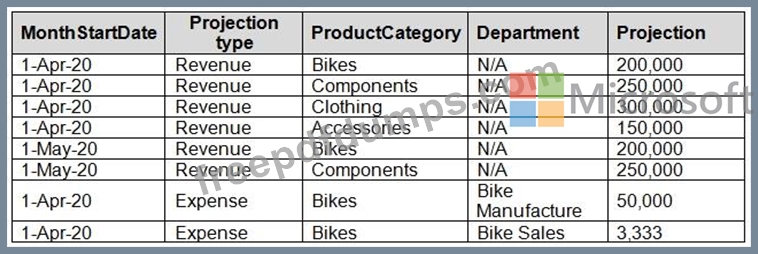
Net Income Projection Data
Net income projection data is stored in a SharePoint Online list named Projections in the format shown in the following table.
Revenue projections are set at the monthly level and summed to show projections for the quarter.
Balance Sheet Data
The balance sheet data is imported with final balances for each account per month in the format shown in the following table.
There is always a row for each account for each month in the balance sheet data.
Dynamics 365 Business Central Data
Business Central contains a product catalog that shows how products roll up to product categories, which roll up to business units. Revenue data is provided at the date and product level. Expense data is provided at the date and department level.
Business Issues
Historically, it has taken two analysts a week to prepare the reports for the quarterly board meetings. Also, there is usually at least one issue each quarter where a value in a report is wrong because of a bad cell reference in an Excel formula. On occasion, there are conflicting results in the reports because the products and departments that roll up to each business unit are not defined consistently.
Planned Changes
Contoso plans to automate and standardize the quarterly reporting process by using Microsoft Power Bl. The company wants to how long it takes to populate reports to less than two days. The company wants to create common logic for business units, products, and departments to be used across all reports, including, but not limited, to the quarterly reporting for the board.
Technical Requirements
Contoso wants the reports and datasets refreshed with minimal manual effort The company wants to provide a single package of reports to the board that contains custom navigation and links to supplementary information.
Maintenance, including manually updating data and access, must be minimized as much as possible.
Security Requirements
The reports must be made available to the board from powerbi.com. A mail-enabled security group will be used to share information with the board.
The analysts responsible for each business unit must see all the data the board sees, except the profit and loss data, which must be restricted to only their business unit's data. The analysts must be able to build new reports from the dataset that contains the profit and loss data, but any reports that the analysts build must not be included in the quarterly reports for the board. The analysts must not be able to share the quarterly reports with anyone.
Report Requirements
You plan to relate the balance sheet to a standard date table in Power Bl in a many-to-one relationship based on the last day of the month. At least one of the balance sheet reports in the quarterly reporting package must show the ending balances for the quarter, as well as for the previous quarter.
Projections must contain a column named RevenueProjection that contains the revenue projection amounts. A relationship must be created from Projections to a table named Date that contains the columns shown in the following table.
The relationships between products and departments to business units must be consistent across all reports.
The board must be able to get the following information from the quarterly reports:
- Revenue trends over time
- Ending balances for each account
- A comparison of expenses versus projections by quarter
- Changes in long-term liabilities from the previous quarter
- A comparison of quarterly revenue versus the same quarter during the
prior year
Hotspot Question
You need to grant access to the business unit analysts.
What should you configure? To answer, select the appropriate options in the answer area. NOTE:
Each correct selection is worth one point.
DA-100 Exam Question 33
You are creating an analytics report that will consume data from the tables shown in the following table.
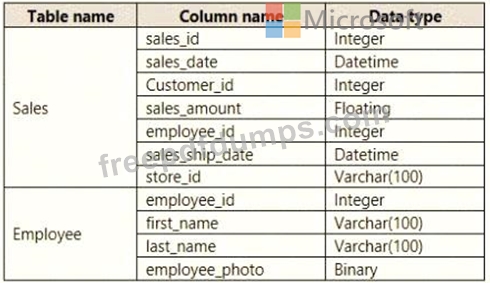
There is a relationship between the tables.
There are no reporting requirements on employeejd and employee_photo.
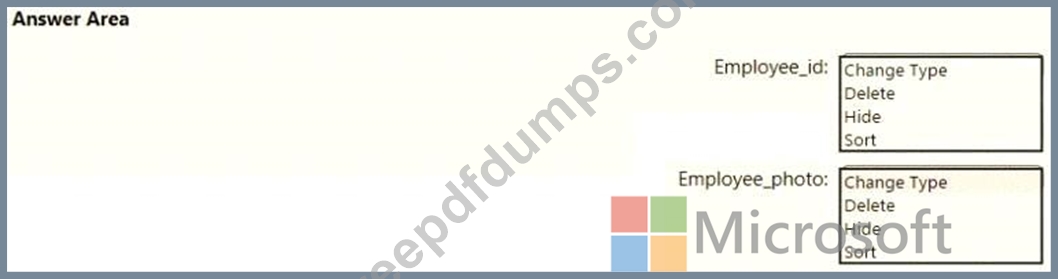
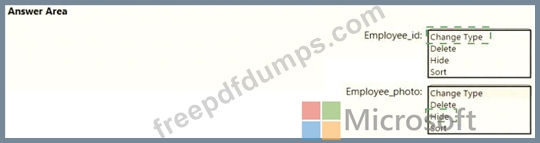
You need to optimize the data model
What should you configure for employeejd and employee.photo? To answer, select the appropriate options in the answer area.
There is a relationship between the tables.
There are no reporting requirements on employeejd and employee_photo.
You need to optimize the data model
What should you configure for employeejd and employee.photo? To answer, select the appropriate options in the answer area.
DA-100 Exam Question 34
You are creating a visual to show the ranking of product categories by sales revenue.
Your company's security policy states that you cannot send data outside of your Microsoft Power Bl tenant Which approach provides the widest variety of visuals while adhering to the security policy?
Your company's security policy states that you cannot send data outside of your Microsoft Power Bl tenant Which approach provides the widest variety of visuals while adhering to the security policy?
DA-100 Exam Question 35
You have a Microsoft Power Bl report. The size of PBIX file is 550 MB. The report is accessed by using an App workspace in shared capacity of powerbi.com.
The report uses an imported dataset that contains one fact table. The fact table contains 12 million rows. The dataset is scheduled to refresh twice a day at 08:00 and 17:00.
The report is a single page that contains 15 custom visuals and 10 default visuals.
Users say that the report is slow to load the visuals when they access and interact with the report You need to recommend a solution to improve the performance of the report.
What should you recommend?