
DA-100 Exam Question 41
Note: This question is part of a series of questions that present the same scenario. Each question in the series contains a unique solution that might meet the stated goals. Some question sets might have more than one correct solution, while others might not have a correct solution.
After you answer a question in this scenario, you will NOT be able to return to it. As a result, these questions will not appear in the review screen.
You have a clustered bar chart that contains a measure named Salary as the value and a field named Employee as the axis. Salary is present in the data as numerical amount representing US dollars.
You need to create a reference line to show which employees are above the median salary.
Solution: You create an average line by using the Salary measure.
Does this meet the goal?
DA-100 Exam Question 42
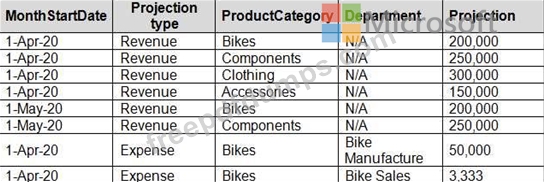
Which two types of visualizations can be used in the balance sheet reports to meet the reporting goals?
Each correct answer presents part of the solution.
NOTE: Each correct selection is worth one point.
Each correct answer presents part of the solution.
NOTE: Each correct selection is worth one point.
DA-100 Exam Question 43
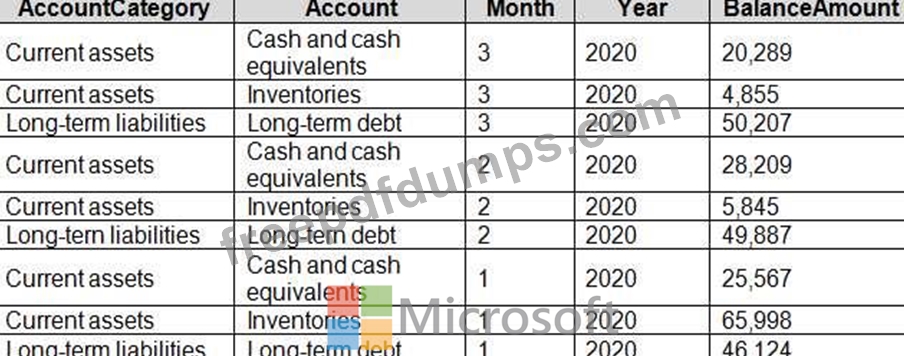
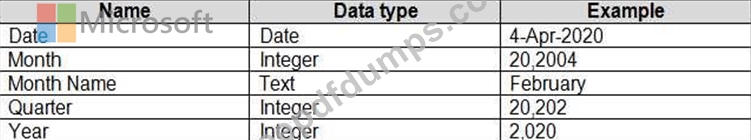
You need to create relationships to meet the reporting requirements of the customer service department.
What should you create?
What should you create?
DA-100 Exam Question 44
You have a Power BI Desktop project that has the model shown in the exhibit. (Click the Exhibit tab.)
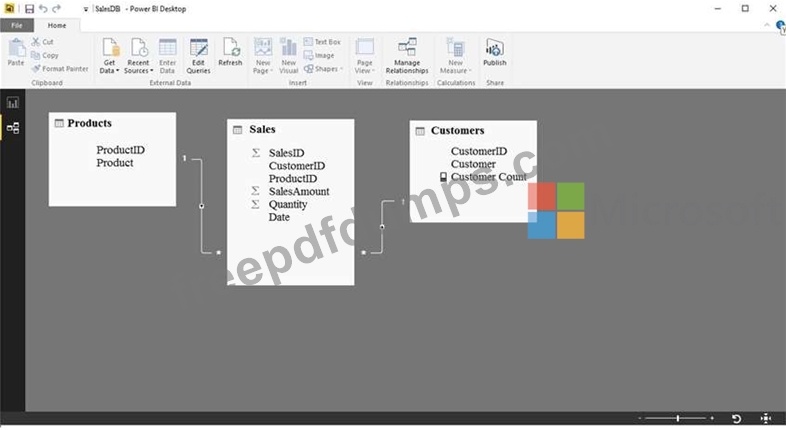
Customer Count is a measure that uses the CountRows function to calculate the number of customers.
You create a table visualization that displays ProductID, Product, and Customer Count.
When you view the table, you discover that Customer Count always displays the total number of customers instead of the number of customers who purchased the product.
You need to ensure that the table visualization displays the number of customers who purchased each product.
What should you do?
DA-100 Exam Question 45
You use an R visual to produce a map of 500,000 customers. You include the values of CustomerID, Latitude, and Longitude in the fields sent to the visual. Each customer ID is unique.
In powerbi.com, when users load the visual, they only see some of the customers.
What is the cause of the issue?
In powerbi.com, when users load the visual, they only see some of the customers.
What is the cause of the issue?