
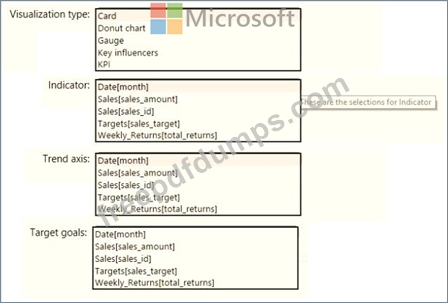
DA-100 Exam Question 51
You need to create a visualization to meet the reporting requirements of the sales managers.
How should you create the visualization? To answer, select the appropriate options in the answer area.
NOTE: Each correct selection is worth one point.
How should you create the visualization? To answer, select the appropriate options in the answer area.
NOTE: Each correct selection is worth one point.
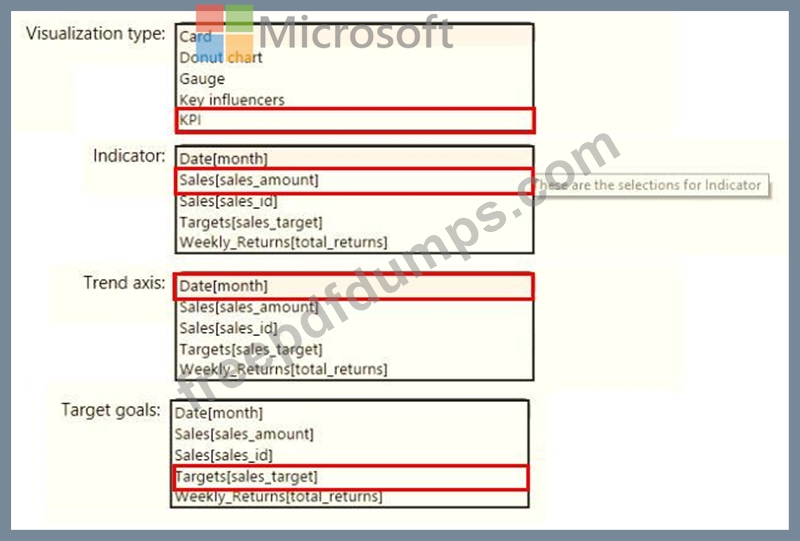
DA-100 Exam Question 52
You have the tables shown in the following table.
The Impressions table contains approximately 30 million records per month.
You need to create an ad analytics system to meet the following requirements:
* Present ad impression counts for the day, campaign, and Site_name. The analytics for the last year are required.
* Minimize the data model size.
Which two actions should you perform? Each correct answer presents part of the solution.
NOTE: Each correct selection is worth one point.
DA-100 Exam Question 53
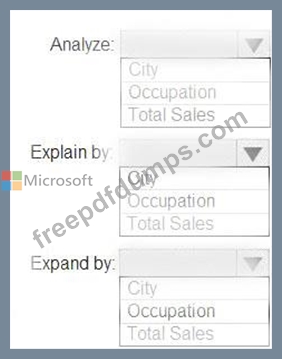
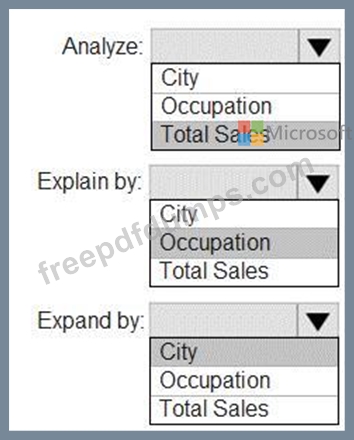
You have a table that contains the following three columns:
* City
* Total Sales
* Occupation
You need to create a key influencers visualization as shown in the exhibit. (Click the Exhibit tab.)
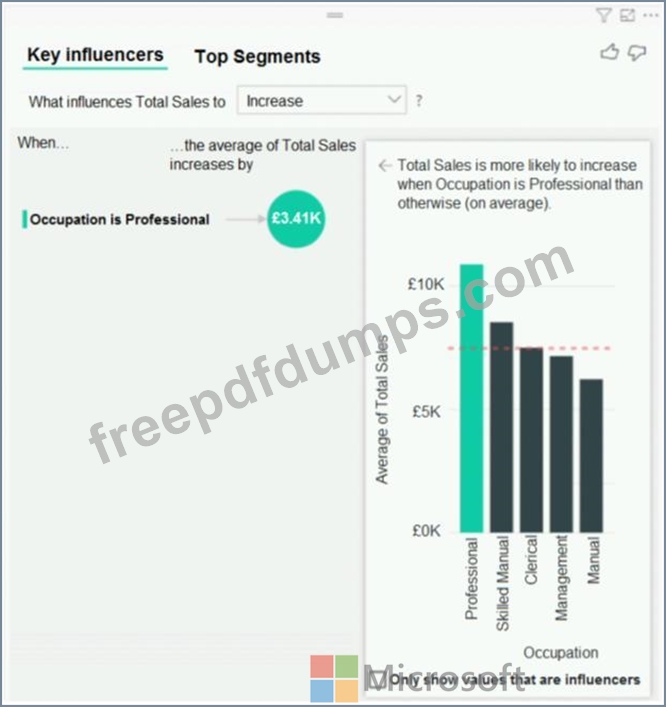
How should you configure the visualization? To answer, select the appropriate options in the answer area.
NOTE: Each correct selection is worth one point.
* City
* Total Sales
* Occupation
You need to create a key influencers visualization as shown in the exhibit. (Click the Exhibit tab.)
How should you configure the visualization? To answer, select the appropriate options in the answer area.
NOTE: Each correct selection is worth one point.
DA-100 Exam Question 54
You have a report that contains a bar chart and a column chart. The bar chart shows customer count by customer segment. The column chart shows sales by month.
You need to ensure that when a segment is selected in the bar chart, you see which portion of the total sales for the month belongs to the customer segment.
How should the visual interactions be set on the column chart when the bar chart is selected?
You need to ensure that when a segment is selected in the bar chart, you see which portion of the total sales for the month belongs to the customer segment.
How should the visual interactions be set on the column chart when the bar chart is selected?
DA-100 Exam Question 55
You have a report that contains a bar chart and a column chart. The bar chart shows customer count by customer segment. The column chart shows sales by month.
You need to ensure that when a segment is selected in the bar chart, you see which portion of the total sales for the month belongs to the customer segment.
How should the visual interactions be set on the column chart when the bar chart is selected?
You need to ensure that when a segment is selected in the bar chart, you see which portion of the total sales for the month belongs to the customer segment.
How should the visual interactions be set on the column chart when the bar chart is selected?
Premium Bundle
Newest DA-100 Exam PDF Dumps shared by Actual4test.com for Helping Passing DA-100 Exam! Actual4test.com now offer the updated DA-100 exam dumps, the Actual4test.com DA-100 exam questions have been updated and answers have been corrected get the latest Actual4test.com DA-100 pdf dumps with Exam Engine here:
(150 Q&As Dumps, 30%OFF Special Discount: Freepdfdumps)