DA-100 Exam Question 31
You have the tables shown in the following table.
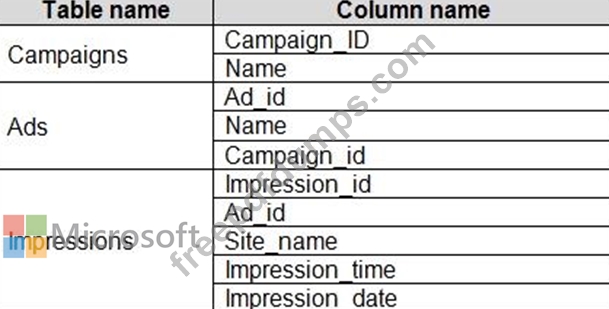
The Impressions table contains approximately 30 million records per month.
You need to create an ad analytics system to meet the following requirements:
- Present ad impression counts for the day, campaign, and Site_name.
The analytics for the last year are required.
- Minimize the data model size.
Which two actions should you perform? Each correct answer presents part of the solution.
NOTE: Each correct selection is worth one point.
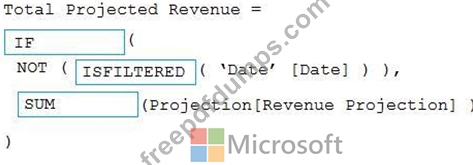
DA-100 Exam Question 32
You need to create a DAX measure in the data model that only allows users to see projections at the appropriate levels of granularity.
How should you complete the measure? To answer, drag the appropriate values to the correct targets. Each value may be used once, more than once, or not at all. You may need to drag the split bar between panes or scroll to view content.
NOTE: Each correct selection is worth one point.

How should you complete the measure? To answer, drag the appropriate values to the correct targets. Each value may be used once, more than once, or not at all. You may need to drag the split bar between panes or scroll to view content.
NOTE: Each correct selection is worth one point.

DA-100 Exam Question 33
You are creating a Microsoft Power Bl imported data model to perform basket analysis. The goal of the analysis is to identify which products are usually bought together in the same transaction across and within sales territories.
You import a fact table named Sales as shown in the exhibit. (Click the Exhibit tab.)
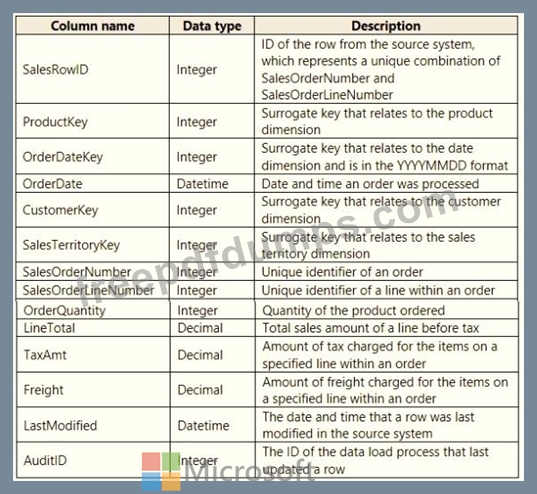
The related dimension tables are imported into the model.
Sales contains the data shown in the following table.

You import a fact table named Sales as shown in the exhibit. (Click the Exhibit tab.)
The related dimension tables are imported into the model.
Sales contains the data shown in the following table.

DA-100 Exam Question 34
You import two Microsoft Excel tables named Customer and Address into Power Query. Customer contains the following columns:
* Customer ID
* Customer Name
* Phone
* Email Address
* Address ID
Address contains the following columns:
* Address ID
* Address Line 1
* Address Line 2
* City
* State/Region
* Country
* Postal Code
The Customer ID and Address ID columns represent unique rows.
You need to create a query that has one row per customer. Each row must contain City, State/Region, and Country for each customer.
What should you do?
DA-100 Exam Question 35
Case Study 2 - Contoso Ltd
Overview
Existing Environment
Contoso, Ltd. is a manufacturing company that produces outdoor equipment Contoso has quarterly board meetings for which financial analysts manually prepare Microsoft Excel reports, including profit and loss statements for each of the company's four business units, a company balance sheet, and net income projections for the next quarter.
Data and Sources
Data for the reports comes from three sources. Detailed revenue, cost and expense data comes from an Azure SQL database. Summary balance sheet data comes from Microsoft Dynamics 365 Business Central. The balance sheet data is not related to the profit and loss results, other than they both relate to dates.
Monthly revenue and expense projections for the next quarter come from a Microsoft SharePoint Online list. Quarterly projections relate to the profit and loss results by using the following shared dimensions: date, business unit, department, and product category.
Net Income Projection Data
Net income projection data is stored in a SharePoint Online list named Projections in the format shown in the following table.
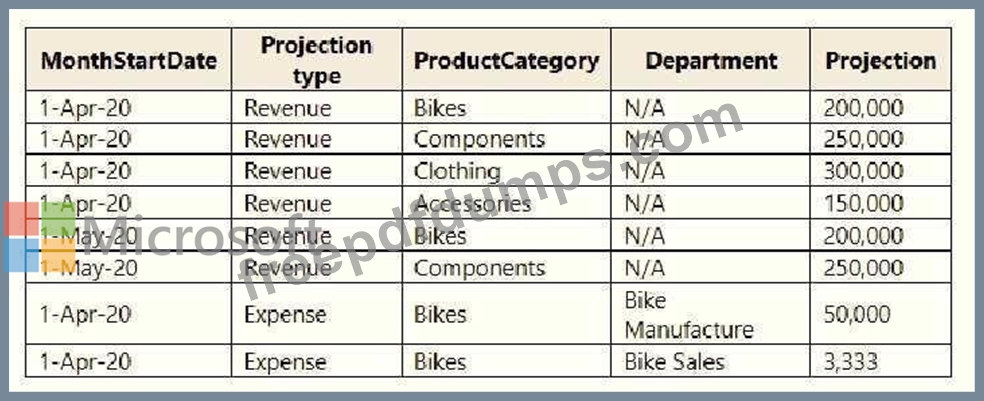
Revenue projections are set at the monthly level and summed to show projections for the quarter.
Balance Sheet Data
The balance sheet data is imported with final balances for each account per month in the format shown in the following table.
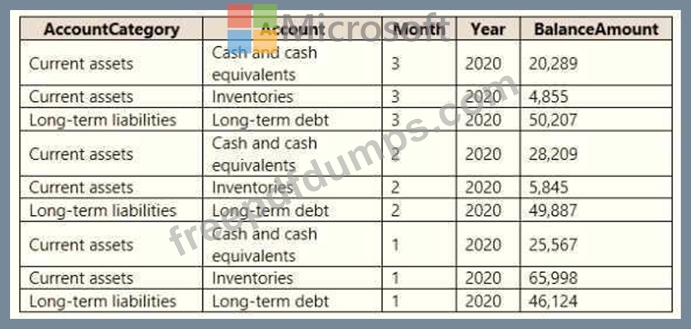
There is always a row for each account for each month in the balance sheet data.
Dynamics 365 Business Central Data
Business Central contains a product catalog that shows how products roll up to product categories, which roll up to business units. Revenue data is provided at the date and product level. Expense data is provided at the date and department level.
Business Issues
Historically, it has taken two analysts a week to prepare the reports for the quarterly board meetings. Also, there is usually at least one issue each quarter where a value in a report is wrong because of a bad cell reference in an Excel formula. On occasion, there are conflicting results in the reports because the products and departments that roll up to each business unit are not defined consistently.
Planned Changes
Contoso plans to automate and standardize the quarterly reporting process by using Microsoft Power Bl. The company wants to how long it takes to populate reports to less than two days. The company wants to create common logic for business units, products, and departments to be used across all reports, including, but not limited, to the quarterly reporting for the board.
Technical Requirements
Contoso wants the reports and datasets refreshed with minimal manual effort The company wants to provide a single package of reports to the board that contains custom navigation and links to supplementary information.
Maintenance, including manually updating data and access, must be minimized as much as possible.
Security Requirements
The reports must be made available to the board from powerbi.com. A mail-enabled security group will be used to share information with the board.
The analysts responsible for each business unit must see all the data the board sees, except the profit and loss data, which must be restricted to only their business unit's data. The analysts must be able to build new reports from the dataset that contains the profit and loss data, but any reports that the analysts build must not be included in the quarterly reports for the board. The analysts must not be able to share the quarterly reports with anyone.
Report Requirements
You plan to relate the balance sheet to a standard date table in Power Bl in a many-to-one relationship based on the last day of the month. At least one of the balance sheet reports in the quarterly reporting package must show the ending balances for the quarter, as well as for the previous quarter.
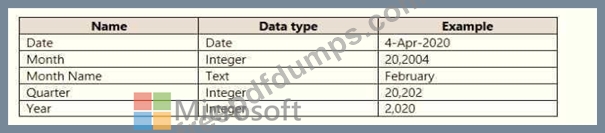
Projections must contain a column named RevenueProjection that contains the revenue projection amounts. A relationship must be created from Projections to a table named Date that contains the columns shown in the following table.
The relationships between products and departments to business units must be consistent across all reports.
The board must be able to get the following information from the quarterly reports:
- Revenue trends over time
- Ending balances for each account
- A comparison of expenses versus projections by quarter
- Changes in long-term liabilities from the previous quarter
- A comparison of quarterly revenue versus the same quarter during the
prior year
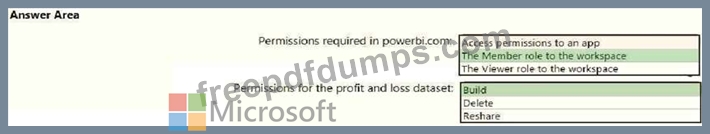
Hotspot Question
You need to grant access to the business unit analysts.
What should you configure? To answer, select the appropriate options in the answer area. NOTE:
Each correct selection is worth one point.
Overview
Existing Environment
Contoso, Ltd. is a manufacturing company that produces outdoor equipment Contoso has quarterly board meetings for which financial analysts manually prepare Microsoft Excel reports, including profit and loss statements for each of the company's four business units, a company balance sheet, and net income projections for the next quarter.
Data and Sources
Data for the reports comes from three sources. Detailed revenue, cost and expense data comes from an Azure SQL database. Summary balance sheet data comes from Microsoft Dynamics 365 Business Central. The balance sheet data is not related to the profit and loss results, other than they both relate to dates.
Monthly revenue and expense projections for the next quarter come from a Microsoft SharePoint Online list. Quarterly projections relate to the profit and loss results by using the following shared dimensions: date, business unit, department, and product category.
Net Income Projection Data
Net income projection data is stored in a SharePoint Online list named Projections in the format shown in the following table.
Revenue projections are set at the monthly level and summed to show projections for the quarter.
Balance Sheet Data
The balance sheet data is imported with final balances for each account per month in the format shown in the following table.
There is always a row for each account for each month in the balance sheet data.
Dynamics 365 Business Central Data
Business Central contains a product catalog that shows how products roll up to product categories, which roll up to business units. Revenue data is provided at the date and product level. Expense data is provided at the date and department level.
Business Issues
Historically, it has taken two analysts a week to prepare the reports for the quarterly board meetings. Also, there is usually at least one issue each quarter where a value in a report is wrong because of a bad cell reference in an Excel formula. On occasion, there are conflicting results in the reports because the products and departments that roll up to each business unit are not defined consistently.
Planned Changes
Contoso plans to automate and standardize the quarterly reporting process by using Microsoft Power Bl. The company wants to how long it takes to populate reports to less than two days. The company wants to create common logic for business units, products, and departments to be used across all reports, including, but not limited, to the quarterly reporting for the board.
Technical Requirements
Contoso wants the reports and datasets refreshed with minimal manual effort The company wants to provide a single package of reports to the board that contains custom navigation and links to supplementary information.
Maintenance, including manually updating data and access, must be minimized as much as possible.
Security Requirements
The reports must be made available to the board from powerbi.com. A mail-enabled security group will be used to share information with the board.
The analysts responsible for each business unit must see all the data the board sees, except the profit and loss data, which must be restricted to only their business unit's data. The analysts must be able to build new reports from the dataset that contains the profit and loss data, but any reports that the analysts build must not be included in the quarterly reports for the board. The analysts must not be able to share the quarterly reports with anyone.
Report Requirements
You plan to relate the balance sheet to a standard date table in Power Bl in a many-to-one relationship based on the last day of the month. At least one of the balance sheet reports in the quarterly reporting package must show the ending balances for the quarter, as well as for the previous quarter.
Projections must contain a column named RevenueProjection that contains the revenue projection amounts. A relationship must be created from Projections to a table named Date that contains the columns shown in the following table.
The relationships between products and departments to business units must be consistent across all reports.
The board must be able to get the following information from the quarterly reports:
- Revenue trends over time
- Ending balances for each account
- A comparison of expenses versus projections by quarter
- Changes in long-term liabilities from the previous quarter
- A comparison of quarterly revenue versus the same quarter during the
prior year
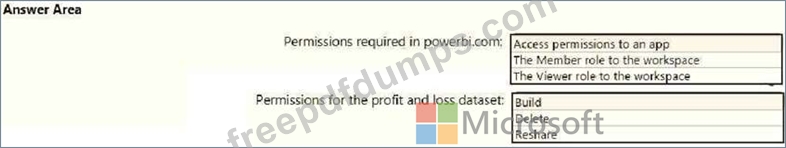
Hotspot Question
You need to grant access to the business unit analysts.
What should you configure? To answer, select the appropriate options in the answer area. NOTE:
Each correct selection is worth one point.